The Cure: How Tackling Waste and Abuse in Annapolis Could Eliminate the State Debt and Release a Billion Dollars a Year for Tax Cuts
About the Authors
Paul O. Ballou III, C.P.A.
Until very recently, Paul O. Ballou III served the 188 members of the General Assembly in a number of capacities, namely, fiscal-note writer, committee staffer, budget analyst, trainer in statistical quantification skills and coordinator for public speaking. His areas of expertise include: taxes, transportation, pension systems and education. Mr. Ballou holds an M.B.A. degree and a B.S. in accounting, both from the University of Kentucky. He is also a certified public accountant. He worked for the General Assembly and the Department of Legislative Services for nine years.
William R. Miles, M.S.
For 17 years, William R. Miles served in the General Assembly as a committee staffer, bureau chief of the fiscal-note system and then principal policy advisor for two speakers of the Maryland House of Delegates, R. Clayton Mitchell, Jr. and Casper R. Taylor, Jr. Mr. Miles’ areas of expertise are: taxes, budgetary and fiscal policies, and the environment He holds a B.A. degree in government and economics from the University of Maryland at College Park and a masters of finance degree from the University of Oklahoma. He now runs his own consulting firm, which specializes in performance measuring for government entities, statistical surveys and strategic planning.
Douglas P. Munro, Ph.D.
Douglas P. Munro has been involved in public-policy issues for a number of years. He completed his doctoral dissertation at the Johns Hopkins University in Baltimore in 1992. He then served as a researcher at the Heritage Foundation in Washington, D.C. and, later, as the senior policy analyst at the Southern Governors’ Association. During this period, he conducted extensive research into the cost of federal mandates on state government for the Wisconsin Policy Research Institute in Milwaukee and the Goldwater Institute in Phoenix, Arizona. In 1995, Munro co-founded the Calvert Institute for Policy Research, Inc., of which he is the president. The institute is Maryland’s first independent, market-oriented research institute, or “think tank,” to focus exclusively on state and local concerns.
 |
| From left to right, authors William R. Miles, Douglas P Alunro and Paul 0. Ballou HI. The analysts propose a plan to eliminate the state general obligation debt entirely and free up over $1 billion for tax cuts. |
Executive Summary
A casual approach to the cost and size of government has been a tradition in Maryland. State and local personal income taxation is among the very highest per capita in the country, a fact that has elicited remarkably little interest among the intelligentsia. This is despite a recently published warning by the Glendening administration’s own secretary of business and economic development, James Brady, that such confiscatory fiscal policy serves as a “red flag” to businesses. Secretary Brady has since resigned, and virtually no headway has been made on his recommendation that income taxes be cut by 25 percent by 2005. Governor Glendening’s much-publicized 10 percent tax cut has turned out to be no such thing. After the General Assembly got through with the bill in 1997, the scope of the rate reduction had been whittled down to five percent. The fact is, discussions of fiscal policy in Maryland revolve almost exclusively around questions of revenue. Expenditure reductions are rarely mentioned. The governor’s modest tax-cutting program, for example, has been financed entirely through revenue surpluses. No program cuts have been announced. In an election year, we may rest assured that none will be.
Meanwhile, the state continues to run up debt on stadiums and the like. By the end of this fiscal year (FY 1999), the cumulative debt will stand at $3.5 billion, necessitating $418.5 million in debt-service payments. By 2007, the debt will be $4.5 billion, requiring $633.5 million in maintenance payments. This is not discussed in polite society.
This is Annapolis’ way. Calvert’s proposal stands in stark contrast. It is targeted. It is precise. While modest as a proportion of overall state spending – five percent of this year’s budget – the cuts we identify are nonetheless of greater magnitude than anything proposed by recent legislative or gubernatorial commissions. Unlike other commissions, we identify specific programs and agencies for termination. Due to Calvert’s novel approach, described below, our cuts leverage the largest tax cut in Maryland history – far out of proportion to our program cuts.
Our recommended program cuts and interfund transfers total $870 million in the first year and $634 million a year thereafter. The twist that sets this study apart is that we do not propose sinking our cuts into tax reductions, not directly at least. Rather, the state should use our savings to buy back all outstanding general-obligation debt.
As any credit-card holder knows, paying down your outstanding balance reduces your monthly minimum principal and interest payments. Our plan works in the same way: Pay off the debt and return the money saved on debt-service payments to the public in the form of tax cuts. Over the long run, this leverages tax cuts of greater size than would be achieved by returning the savings directly to taxpayers. In its first year, the Calvert plan could leverage funds for a tax cut of $321.5 million. By 2007, this tax-cut figure would have escalated to $1.03 billion. Annual funds for tax cuts would grow after that. This is because the difference between Annapolis’ planned, ever-mounting debt-service expenses and Calvert’s nonexistent debt-service costs would become larger with every passing year. It is this difference that funds the Calvert tax cuts.
To pay for our plan, we identify a series of program cuts and interfund transfers. Many of our recommendations have been previously identified by various government agencies as areas ripe for targeting. This is probably the most disturbing aspect of our findings: not that the state annually squanders millions of dollars on programs of doubtful worth, but that it does it in the full knowledge that it is doing so. To be wrong in ignorance is one thing; to be wrong and fully aware of it is entirely another. Some highlights of our program cuts:
- School districts’ “over billing” of Annapolis for intergovernmental funding for nonexistent students. This ranges from $10.3 million by Baltimore City to $28.5 million by the already lavishly funded Montgomery County. We recommend a systematic audit of all school-district claims, for a projected annual savings of $179 million (pp. 44-47).
- State agencies’ “over billing” of the government for nonexistent employees. By minimizing expected vacancy rates, agencies receive some $93 million a year more than they are properly entitled to. We recommend that agencies be forced to utilize historical precedent to project vacancy rates (pp. 29-33).
- The “prevailing wage” mandate upon public-sector construction projects. This forces contractors to pay inflated union rates, forcing up costs by as much as 15 percent. We build upon a Department of Legislative Services analysis to project an annual savings of $38.6 million upon the repeal of the prevailing-wage statute (pp. 37-38).
- Maryland funds three preservation programs with similar aims: Program Open Space (POS), the Agricultural Land Preservation Program and Rural Legacy. Maryland should reduce its involvement in the real estate business by terminating state subsidy of county land purchases under POS. County governments are now very fiscally healthy. If preservation is vital to them, they may use their own funds, saving taxpayers $24.2 million (pp.49-51).
- In addition to the regular Maryland State Retirement Agency, which administers state employees’ pensions, the state funds an entirely separate Teachers’ and State Employees’ Supplemental Retirement Agency. This hopelessly duplicative agency should be terminated, for an annual savings of $1.1 million (p. 61).
These plus other savings make up a total of $870.3 million in the first year and $635.8 million after that. This is the price of over $1 billion in tax cuts – an outstanding rate of return.
– Douglas P. Munro, Editor
I. The Maryland Disease
Back in the 1970s, a series of Labour and moderate Conservative governments in the United Kingdom ushered in a period of expanding government, high inflation, massive budget deficits, incessant industrial disputes, low growth and ever-present general economic malaise. It was known at the time as the “British disease.” While hardly in the same league, Maryland exhibits certain similarities. The state government’s penchant for growth is unchecked, while private-sector growth remains relatively flat, at least compared to Maryland’s immediate competitors. From April 1997 through April 1998, employment within the state grew by 1.0 percent. Certainly, any growth is welcome. However, the national rate of employment growth over the same period was 2.0 percent. Two of Maryland’s most immediate competitors, Virginia and Delaware, saw their employment grow by 3.0 percent and 3.5 percent, respectively.1 This has been a chronic problem for Maryland, whose business climate is often held to be hostile, so much so as to merit a lengthy recent report published by the state Department of Business and Economic Development.2 This, then, is the Maryland disease – a disease characterized by high taxes, escalating state debt and unchecked spending mandated under state law.
This paper proposes a cure for the disease. Over the ensuing pages, we shall outline a strategy for entirely eliminating the state general-obligation debt – now $3.3 billion and rising – while simultaneously freeing up enough funds to provide for the largest personal income-tax cut in Maryland history. We achieve this by identifying millions of dollars of wasteful expenditures on programs of doubtful merit. Under our plan, these funds would be redirected to buying back all outstanding state general-obligation debt over the course of two gubernatorial terms, $870.3 million in the first year and $635.8 million a year thereafter. This purchasing of the debt will make funds available for tax cuts by reducing, ultimately to zero, the annual state appropriation necessary for debt-service payments. If our plan is followed through, starting in fiscal year (FY) 2000 funds will be available for some $321.5 million in tax cuts. By FY 2006, this annual tax-reduction figure will have risen to $1.02 billion, increasing to $1.03 billion the following year.
Background
Maryland was rocked by recession from 1991 through 1993. State lawmakers were forced to make cumulative cuts from baseline of $2.1 billion during the three-year period. (“Cuts from baseline” refers to cuts from previously projected expenditure levels, including expected budget increases for inflation, program expansion, etc.)3 Programs were eliminated, entitlements were reduced, some employees lost their jobs and some local-aid programs were terminated.4 This unprecedented action was necessary for Maryland to comply with its constitutional mandate for an annually balanced operating budget.
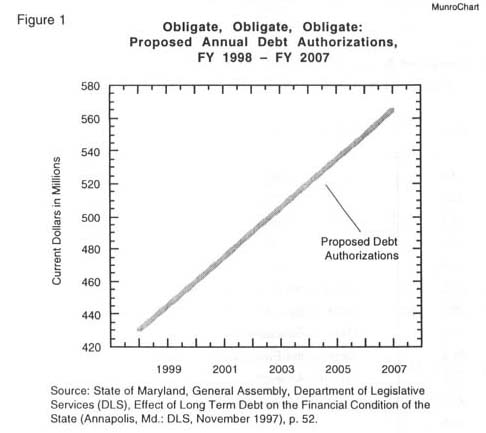
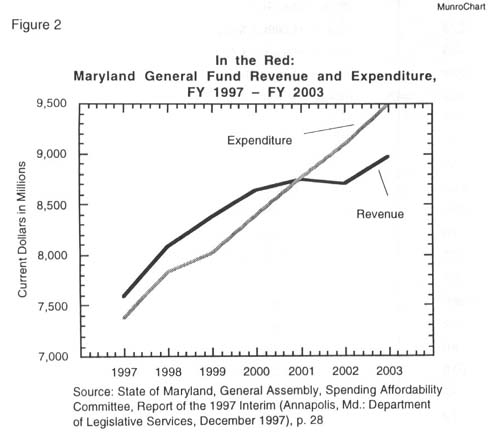
These days, modest annual growth for Maryland is projected for the next few years, as shown in table 1. However, acceptable performance for the moment should not blind policy makers to the serious long-term structural problems facing this state. Maryland’s current cumulative debt as we enter FY 1999 is $3.3 billion, a figure anticipated to rise to $4.5 billion by the end of FY 2007.5 Principal and interest payments on the $3.3 billion debt were $417.8 million in FY 1998.6 These annual payments will rise to $633.5 million in 2007 if the cumulative debt reaches the figure anticipated. Meanwhile, the projected annual debt authorization for 2007 is $565 million,7 a sum 31.3 percent higher than fiscal 1998’s borrowing of $430 million. This ever increasing debt load is being fueled by new borrowing recommended year after year, as shown in figure 1.8 With nearly $1 of every $2 of state expenditure mandated by law, and thus subject to relatively little scrutiny, general-fund expenditures in Maryland will soon outpace revenues, as shown in figure 2. The graph illustrates that by FY 2003, Maryland will be facing a structural operating deficit of $514.5 million (i.e., the gap between the two lines).9
Spending must be, in a word, cut. Maintaining Maryland’s penchant for high spending has two particularly unfortunate side effects (in addition to the straightforward frittering away of public funds on projects of dubious worth). First, it forces the state to keep borrowing funds, thus eternally ratcheting up debt-service costs. Second, it provides a ready excuse to deny tax cuts to state residents. “We urge legislators not to get caught up in a tax-cut frenzy,” the Baltimore Sun recently intoned sternly. “Are they setting Maryland up,” it asked, “for a return to massive shortfalls when the economy fizzles instead of sizzles?”10
This would be a rational warning were it not for faulty underlying logic. The assumption is that annual state expenditure is currently justifiable and, thus, that the only question is how to finance it. By means of indirect revenues generated by a healthy economy? Or by direct means of high state income-tax levels? The establishment fears too much reliance upon the former in preference to the latter. But this fear is based upon a supposition that something akin to current levels of revenue must annually be raised to support current levels of expenditure. We contend that neither is necessary.
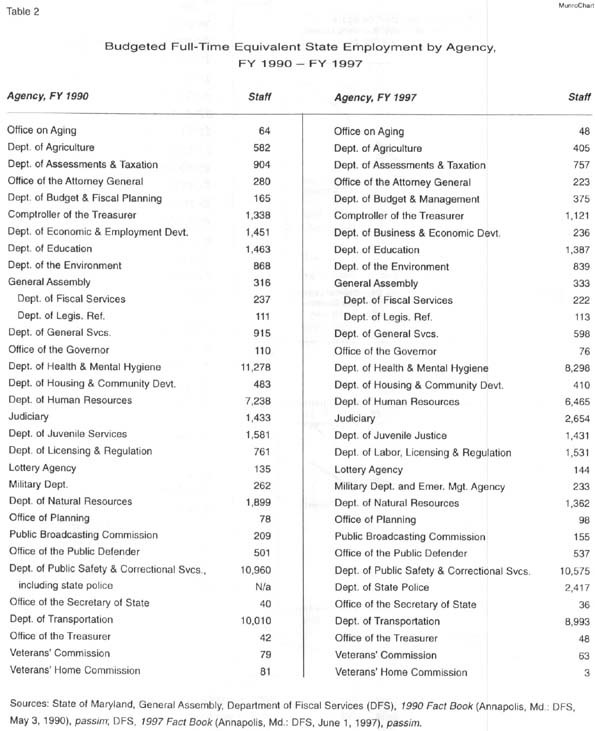
We identify a series of program cuts and propose a debt-elimination strategy that would, in combination, annually save hundreds of millions of dollars without significantly reducing the delivery of necessary services. How does this differ from the cuts made in the early 1990s? Those cuts were cuts within the existing paradigm. Few, if any, serious structural changes were made in Maryland state government. According to the figures shown in table 2, most state agencies now claim fewer employees than they did in FY 1990. These data are misleading, however, for they exclude what are known as “contractual employees,” who technically are not state employees. Such individuals make up an increasing proportion of the state’s work force.
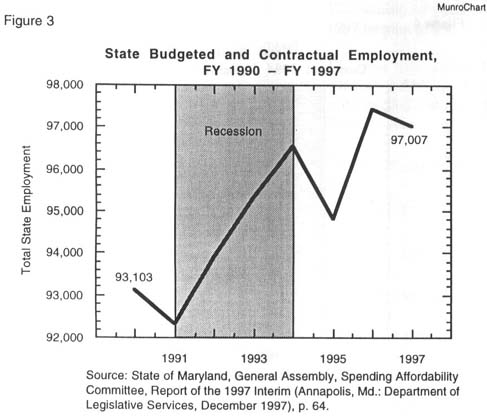
In FY 1990, state contractual workers, University of Maryland contractual workers and General Assembly temporary staff numbered 16,689, which was 22.4 percent of the number of regular state employees. By FY 1997, this had all changed. That year, contractual workers numbered 22,760, the equivalent of 31.8 percent of the regular state work force.11 The advantage of contractual workers is two-fold. First, they are cheaper, as benefits are not included in their compensation packages. Second, the utilization of contractors allows the state to claim it has reduced the number of “state employees” while at the same time actually increasing the state work force. Figure 3 tells the true story. Before the recession, in FY 1990, the state payroll stood at 93,103 (state and contractual employees combined). By FY 1994, immediately after the recession, the payroll for budgeted and contractual employment had reached 96,540 (then going on to hit 97,007 by FY 1997, an increase of 4.2 percent since 1990).12
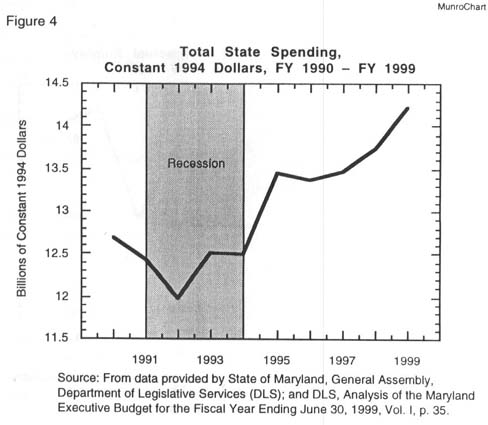
Likewise, real expenditure growth was only temporarily abated during the recession. Expressed in constant 1994 dollars, total state expenditure of all funds was $12.7 billion in FY 1990. In FY 1995, shortly after recovery had set in, disbursement had reached $13.4 billion. Total spending for FY 1999 is projected at $14.2 billion, as shown in figure 4.13 (The nominal-dollar expenditures for FY 1990, FY 1995 and FY 1999 are, respectively, $11.2 billion, $13.8 billion and $16.5 billion.)
The fact is, the state did not seriously make long-term adjustments in response to the recession. The government organizational chart looked much the same in 1994 as it had done four years earlier, despite the efforts of the Governor’s Commission on Efficiency and Economy in Government (discussed below). The organization of the executive branch in FY 1997 was virtually identical to its organization in FY 1990 – except bigger. In other words, recession forced the old gas-guzzler temporarily to drive at 55 m.p.h. to conserve fuel. That is all. Once the revenue embargo was lifted, the pedal could be – and was – pushed back down to the metal. We hold that it is time to take the old jalopy off to the scrap yard, to be replaced by an altogether more aerodynamic and fuel-efficient model.
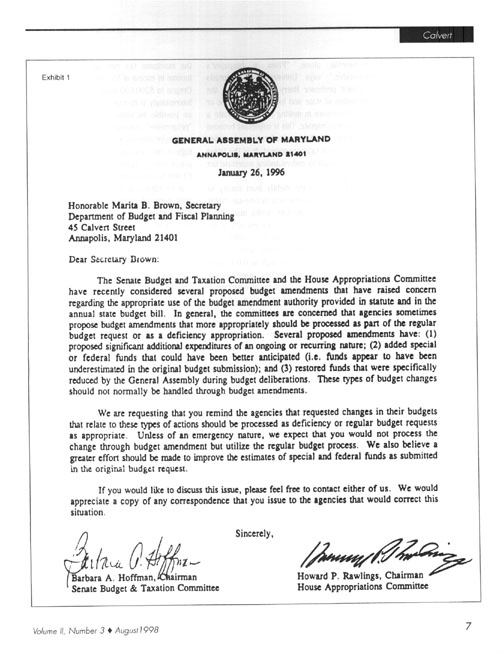
To this day, government scope and budgetary propriety are not taken sufficiently seriously in this state. In January 1996, Senator Barbara A. Hoffman (D-Baltimore County), chairwoman of the Senate Budget and Taxation Committee, and Delegate Howard P. Rawlings (D-Baltimore City), chairman of the House Appropriations Committee, chided the executive branch for introducing post facto budget amendments months after approval of the annual budget, thereby making budget scrutiny difficult. These amendments had, said Hoffman and Rawlings, “(1) proposed significant additional expenditures of an ongoing and recurring nature; (2) added special or federal funds that could have been better anticipated …; and (3) restored funds that were specifically reduced by the General Assembly during budget deliberations. These types of budget changes should not normally be handled through budget amendments.”14 All told, the picture painted was of an executive branch anxious to avoid in-depth legislative scrutiny of its proposed spending. (The letter is reproduced in exhibit 1.)
Fiscal debate in Maryland revolves almost exclusively around questions of revenue. The expenditure component of the fiscal equation has gone largely unnoticed – by the media and by Annapolis. This essay remedies this defect. It presents a blueprint for reduced state spending in Maryland. If Maryland’s disease is ever-expanding government, characterized by the twin symptoms of high taxation and excessive borrowing, then we propose a cure – a cure that would allow this state to buy back all outstanding general-obligation debt over two gubernatorial terms while still allowing funds for immediate and substantial tax relief, starting in FY 2000 with a 7.48 percent cut from projected income-tax revenue estimates for that year and continuing to FY 2007 with a 20.21 percent cut. (In other words, implementing our reforms would reduce the state’s reliance on projected income-tax revenue by 20.21 percent in FY 2007.) Tax reductions from current revenue estimates would continue after that, increasing annually from $1.03 billion in FY 2007.
II. The Symptoms: Taxes
Prior to the recent, modest amendments to the tax code, enacted during the 1997 legislative session at the instigation of Governor Parris N. Glendening (D), the situation for Maryland taxpayers was as follows: Maryland’s lowest income-tax rate was 2.0 percent; its highest, 5.0 percent – or 2.4 percent and 8.0 percent if local income taxes are included, depending on the county.15 Maryland is one of only a handful of states that permit local governments to levy income taxes (known locally as “piggyback taxes”), so its combined rates of state and local income taxation are often compared to other regions’ income taxation levied by state governments alone. “From a taxpayer’s perspective,” says University of Colorado economics professor Barry Poulson, “it is the combination of state and local taxes that [he or she] will compare in making choices to locate a business or to migrate. This is important because comparisons are often made of state taxes, rather than state/local taxes combined. It is the latter which is relevant to understanding interstate tax competition.”16
Though rates vary slightly from county to county, Maryland’s lowest local income-tax rate is 20 percent of the state rate, which made for a lowest combined rate of 2.4 percent before the 1997 legislation. The state’s highest possible local rate is 60 percent of the state rate, which allowed a combined effective rate as high as 8.0 percent in some counties. (Most counties’ piggyback-tax rates are 50 percent or 60 percent of state rate or somewhere in between. Only two counties deviate: Talbot County, 40 percent in FY 1998; Worcester County, 20 percent, FY 1998.) The other states allowing local governments – sometimes municipalities rather than counties – to tax personal income are Arkansas, Delaware, Indiana, Iowa, Kentucky, Michigan, Missouri, New York, Ohio and Pennsylvania.17 For the purposes of this section, we take the term “Maryland income taxation” to include local income taxation.
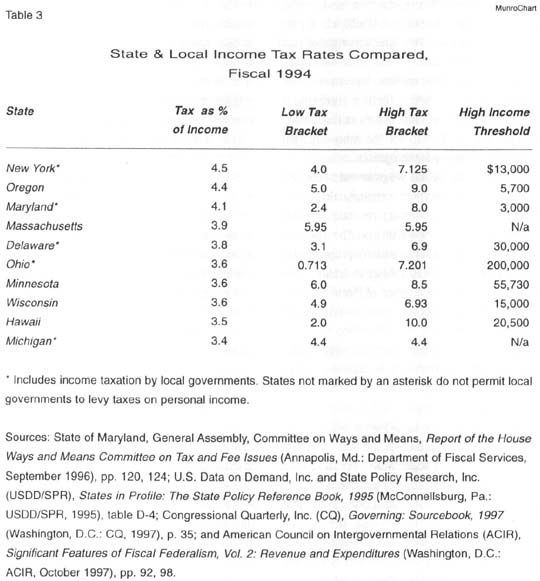
Table 3 presents the ten states with the highest individual income taxes in FY 1994. Even among these high-tax states, Maryland stands out. Before the recent alterations to the tax code, Maryland’s state/local income taxation proportional to income was $39.79 per $1,000 of income next to a U.S. mean of $23.92 per $1,000 (FY 1992).18 At four percent of personal income, Maryland had the third-highest personal income-tax rate in the nation.19 The impact of Maryland’s relatively high top income-tax rate is exacerbated by the fact that it begins imposing the maximum rate – as high as 8.0 percent before 1998, depending on the county – on all taxable income over $3,000. This compares very unfavorably with the other top income-taxing states, where the maximum tax rate applies to all taxable income in excess of $5,700 (lowest threshold) in Oregon to $200,000 (highest threshold) in Ohio. Interestingly, in its zeal to subject as much income as possible to state taxation, presumably for “progressive” purposes, Maryland has devised a very regressive income-taxation system, with its highest tax bracket capturing all but those in abject poverty. Relatively few people have below $3,000 in taxable income.
In FY 1994, a total of $4.9 billion in state and local personal-income taxes was collected on $118.8 billion of personal income. Based on these data, Maryland would have to reduce income-tax revenue by over $800 million annually in order to remove itself from the top ten personal-income taxing states.20 The governor’s 1997 legislation originally proposed to reduce income taxation cumulatively by $990 million over five years.21
The governor’s initiative of 1997 initially proposed to reduce the state-only income taxation rate by 10 percent, whittling the top rate of 5.0 percent down to 4.5 percent by FY 2001. Local governments’ piggyback rates were to have been excluded from the legislation, allowing them to continue levying income taxes at the old rate.22 Assuming that no county cut its piggyback taxes, the combined maximum rate would thus have fallen from 8.0 percent to 7.5 percent. This was in considerable contrast to the plan proposed by the administration’s own Department of Business and Economic Development, which proposed that a 25 percent income-tax cut be phased in by FY 2005.23
However, even the governor’s diluted tax plan failed to pass muster in the General Assembly. After considerable wrangling in the legislature, the plan to reduce the top rate to 4.5 percent was abandoned, with the new target being set for an altogether more modest reduction to 4.75 percent. Forces opposed to the tax reduction instead raised the personal exemption from $1,200 to $2,400 rather than enact the originally planned top-rate reduction, thereby somewhat lessening the regressiveness of the Maryland tax code. Taking these actions into account, the new combined state and local top rate will be 7.75 percent. (The decoupling of piggyback rates from state rates went into effect as planned.) During the 1998 legislative session, the tax-cutting schedule was accelerated to three years.24
However, there is some reason for doubt as to whether or not the full package will ever be ushered in. Last year, the top rate was reduced to 4.95 percent. The new schedule for rate reductions reduces this to 4.875 percent for tax year 1998 and to 4.85 percent for tax year 1999.25 In the meantime, the size of the exemption is gradually being raised. The actions of 1998 have accelerated the process somewhat, but have not altered the fundamental fact that the bulk of the cutting comes in the “out years” (i.e., later in the process). The governor has never identified what program cuts he intends to implement to make the full tax reduction possible.
The entire accelerated tax cut so far has been financed by drawing $170.7 million in FY 199926 from the Revenue Stabilization Account (the so-called “rainy day fund”) to cover potential revenue loss and by taking advantage of 1998’s higher-than-expected state revenues. There exists a “Citizen Tax Reduction and Fiscal Reserve Account,” the purpose of which is in part to fund such tax cuts. This fund was created just after the last election – and then seemingly forgotten. Only $10 million has ever been appropriated to the fund,27 thereby rendering it useless as a source of funding for tax reductions. This explains the need to use the rainy-day fund as a source of money for the present round of tax reductions, for no actual program cuts have yet been made. The governor’s original calculations supposed four-year offsetting revenue of $286 million from a new cigarette tax. The tax was never enacted. The administration’s proposal also vaguely referred to $276 million in “other” cuts not identified. The Department of Fiscal Services calculated that the “other” cuts would actually need to be on the order of $698 million.28
Many skeptics consider Annapolis’ acceleration of the tax-cutting schedule to be typical election-year politics. If Annapolis refuses to commit to the program cuts necessary to fund a tax reduction, how serious can the establishment be? Skeptics further note that, prior to the last election, Annapolis passed legislation creating the Efficiency 2000 Commission, a task force charged with identifying areas for enhanced government efficiency and areas for budget cuts. The creation of the commission – discussed in detail below – was necessary for public-relations purposes, given the legislature’s flat refusal to act upon the recommendations of the similarly charged Butta Commission, which had been created in the wake of the disastrous 1991-1993 recession. Despite the fanfare surrounding the efficiency commission, legislators upon re-election quietly abolished it. Since that time, Annapolis has avoided any effort to make cuts in the size of state government.
Given the governor’s reluctance to identify the program cuts necessary to finance his tax reduction, and given the fact any such cuts are postponed until after the November 1998 election, some Marylanders assume that the rest of the tax cut will be shunted to one side after the election. In 1999, the assembly intends to re-examine the issue “to determine how quickly to cut the remaining 4 percent….”29 The governor’s lukewarm approach to tax reform is widely held to have been a primary cause of the recent resignation of his secretary of business and economic development, James T. Brady.30
If the skeptics are correct in their assumptions about the governor’s intentions – or lack thereof – in regard to seeing through the tax cuts promised, then the situation outlined in table 3 will remain substantially unchanged. The high income-tax rate will, in the words of the Brady report, continue to serve as a “red flag” to businesses considering moving to Maryland. The state’s negative business image, described in detail two years ago by the Department of Business and Economic Development,31 will be retained.
IIl. The Symptoms: Debt
Entering FY 1999, Maryland owes $3.3 billion in general-obligation debt, as noted previously. Forecasts show that this amount will increase to $4.5 billion by the end of FY 2007.32 This is due to Annapolis’ habitual use of 15-year debt financing on bond issues to fund capital programs. Only the state’s operating budget is subject to the constitutional balanced-budget requirement. This is not the case with the capital budget. The capital budget – funding used for big-ticket construction projects and the like – is partly financed by means of bond sales. Borrowing funds for capital projects frees up operating-budget funds for program expansion.
The current $3.3 billion debt refers only to state general-obligation debt – tax-supported, 15-year debt used in part to build, improve and equip state and locally owned capital facilities and in part to provide grants and loans to non-public entities. There is further debt, however – debt associated with highway construction and maintenance. The gas taxes, vehicular titling and registration fees that finance this debt are not discussed here.
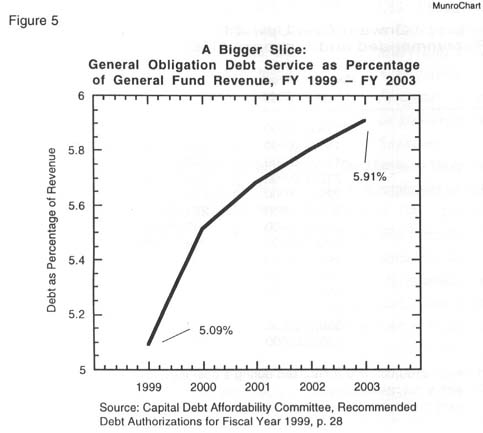
Revised figures indicate that in FY 1998 it cost Maryland taxpayers $417.8 million to make the principal and interest payments on the existing $3.3 billion debt,33 which is about $165 for every taxpayer in the state.34 (Earlier estimates had predicted $423.5 million.)35 During FY 1999, the debt will increase to $3.5 billion, necessitating $418.5 million in principal and interest payments,36 optimistically assuming a continuation of current low interest rates. Maryland has committed itself to staying in debt well into the next century. As figure 5 shows, general-obligation cumulative debt as a percentage of state anticipated revenue will increase from 5.09 percent in FY 1999 to 5.91 percent in FY 2003.37
Naturally, borrowing is sometimes required. However, given the costs of borrowing, we recommend increased reliance on another way to fund projects – using existing revenue, at least to a greater degree than is currently the case. PAYGO expenditures for state capital projects in fiscal 1999 will total $1.16 billion.38 This means spending on a pay-as-you-go basis out of current revenue, with no 15-year debt. Perhaps if voters were made more aware of the long-term costs of borrowing they might be more inclined to demand accountability and restraint. What does borrowing cost? To illustrate, on July 30, 1997, the state sold $250 million in bonds at an interest rate of 4.6396 percent.39 Every $1,000,000 borrowed will cost $1,446,852 to repay in principal and interest over the 15-year life of the loan.40 By the time that June 1997 bond issue of $250 million is fully repaid 15 years from now, it will have cost Maryland taxpayers $361.7 million. That is, $250 million in principal payments and $111.7 million in interest payments. (To put this in some perspective, assuming average salary and benefits of about $40,000 per year, $111.7 million would fund 195 new public school teachers for 15 years.)
Given ever-escalating debt costs, we recommend – at minimum – limiting annual new debt to annual debt redemption. In other words, no new dollar of debt should be incurred without paying off a full dollar of old debt. At its inception back in 1978, the Capital Debt Affordability Committee (CDAC) – an advisory group made up of four government officials and one-private sector member41 – advanced this idea. The committee dropped the idea nine years later. This was principally because there were stadiums to be built, because rating agencies seemed content to give Maryland a triple-A bond rating despite high borrowing requirements, and because adherence to the policy of paying off an old dollar before borrowing a new one tied yearly authorizations to events of 15 years previously. This was held to produce highly variable bond authorizations from year to year, which was said to be inconsistent with either good management or a stable capital program.42 The result has been an endless routine of borrowing upon borrowing ever since. This is ironic, to say the very least. It was this sort of behavior in the 1970s, seen by many as reckless, that had led to the creation of the CDAC in the first place.43
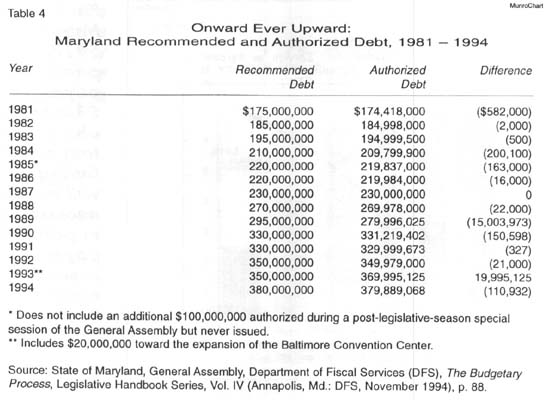
Shortly after the CDAC’s abandonment of the old policy, evidence of Annapolis’ appetite for borrowing was apparent during the recession of the early 1990s. Given Maryland’s constitutional requirement for a balanced operating budget, spending had to be curtailed. Cumulative baseline spending reductions over the period 1991 through 1993 totaled $2.1 billion.44 Every imaginable idea for reducing state spending was suggested – and some of these ideas were even enacted. But this frugality logic did not extend to borrowing. As table 4 illustrates, despite the fiscal crunch, the assembly continued to rack up debt.45 The CDAC’s debt recommendations have increased by about six percent a year, as has the legislatively approved debt.
In addition to adopting a policy of increased reliance upon PAYGO for capital projects, debt-financing should be tied to the state property tax. Maryland’s constitution requires the imposition of a tax to finance annual debt-service costs.46 The tax imposed for this purpose is the state property tax, set at 21¢ per $100 of assessed valuation. All the proceeds from the state property tax are credited to the Annuity Bond Fund for general-obligation debt retirement purposes. But Maryland’s annual debt obligations far exceed available state property-tax revenue. Of FY 1998’s debt-service costs of $417.8 million, only $240.8 million (57.6 percent) was derived from the state property tax. The other $177.1 million (42.4 percent) was primarily taken from the state’s all-purpose general fund.47
As such, this debt-service cost is arguably hidden from taxpayers. Maryland’s budget documents are obtuse to the uninformed reader and are for the most part not broken down to show line items. As a practical matter, paying off old debt with general-fund moneys or with new debt greatly reduces the need to explain the original obligation. The legislative analysis of the FY 1998 budget notes dryly a 4.1 percent increase in debt-service needs and penalty/rebate payments relative to fiscal 1997. But it makes no attempt to explain the rationale behind the expenditure that necessitated the borrowing to start with.48
In spite of the convenience of camouflaging debt servicing within the general fund, its divorce from state property-tax revenues would appear to be contrary to the law, as previously noted by this organization.49 The enabling act which authorizes state debt is straightforward on this matter: “An annual State tax is imposed on all assessable property in the State in rate and amount sufficient to pay the principal and interest rate on the bonds, as and when due and until paid in full.”50 Indeed, the state attorney general has ruled that a bondholder would be entitled to seek legal action requiring the Board of Public Works – made up of the governor, the state treasurer and the comptroller of the Treasury – to collect sufficient property-tax revenues to meet the state’s debt-service obligations in full (rather than hiding the true extent of borrowing by drawing on the general fund and upon new bond issues to pay off part).51
In October 1996, the General Assembly’s financial staff agency, the Department of Fiscal Services (now the Department of Legislative Services), proposed this very notion in a special report to the legislature:52
Revenues generated from an increase in the State property-tax rate could be used to pay the additional cost of the general-obligation bond debt service. This would require an increase in the State property tax of $0.15 per $100 of assessed value, making the new rate $0.36 per $100 of assessed value. The increased property-tax revenues would then free up general-fund revenues that could be used to fund a tax reduction or to pay for other programs….
Since the property tax is deductible for federal and State income-tax purposes, taxpayers who itemize their deduction would realize an income-tax savings for a portion of the additional property tax paid.
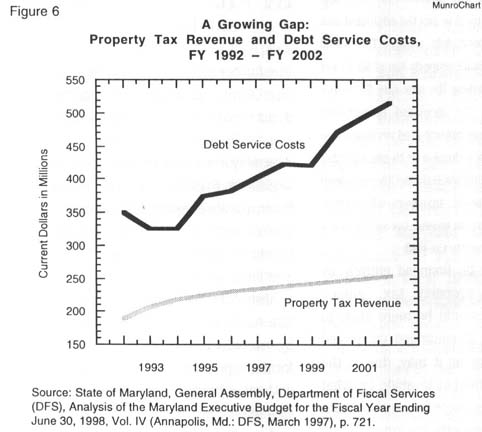
If borrowing had to be financed entirely by means of the state property tax, annual fluctuations in the levy would be more likely to cause residents to balk at continued unchecked bond floatations. Be that as it may, due to the state’s apparent disinclination to abide by what seem to be its own rules, there is a real concern that the gap between property-tax revenue and debt servicing will increase, meaning ever more borrowing hidden from taxpayers.Figure 6 tells the story plainly. In fiscal 1992, property-tax revenues covered 54.1 percent of debt payments. In fiscal 2002, such revenue is projected to amount to only 49.0 percent.53 To put this in some perspective, in fiscal 1966 property-tax revenue accounted for no less than 89 percent of debt service.54 Based upon September 1996 projections, figure 6 shows escalating annual debt payments reaching $515.6 million by 2002,55 though subsequent research indicates that the 2002 figure will in fact be higher ($519.1 million).56
Despite this, ever-increasing borrowing into the 21st century is anticipated for the foreseeable future. Figure 1 in chapter 1 shows ever-increasing proposed borrowing authorizations through 2007. For 2007, borrowing authority of $565 million is suggested, a number 31.4 percent higher than this year’s borrowing.57 A symptom of Maryland’s penchant for a large public sector, Maryland’s debt policy is characterized by growth, not restraint. Currently, nowhere on the horizon is evidence of fiscal restraint to be seen.
IV. The Symptoms: Mandates and Local Aid
One further symptom of Maryland’s ailment is the legislature’s proclivity for mandating certain items of spending. Just how much does Maryland mandate? The question was posed to the General Assembly’s accounting arm, the Department of Legislative Services (DLS), by Delegate D. Bruce Poole (D-Washington) last summer. Apparently, Poole’s request represented the first time any legislator had thought to ask. “The answer was startling,” wrote Poole in an article on the subject published by the Calvert Institute.58 The fact is that nearly half of all state spending is mandated by law, which is to say that annual expenditures for these programs are automatically authorized, without program proponents’ having to go through the inconvenience of legislative hearings and the like. In terms of the general fund, more than one of every two dollars is mandated.
Mandated spending for the just ended FY 1998 within each of the state’s three sources of revenue – general, special and federal – was as follows:
- 56.7 percent of all general-fund spending, $4.42 billion out of $7.78 billion.
- 26.2 percent of all special-fund spending, $1.10 billion out of $4.20 billion.
- 35.8 percent of all federal-fund spending, $1.23 billion out of $3.45 billion.
In sum, 43.7 percent of total state spending in FY 1998 in all categories was mandated, no less than $6.75 billion out of $15.44 billion.59
A selection of Annapolis’ annual, mandated payments is shown in table 5 , in this case for FY 1998. Regardless of the merit of some of these programs, the fact is that, by enshrining their funding in perpetual law, accountability is lost. In government, as elsewhere, the maxim “out of sight, out of mind” applies in force. Mandated program expenditure is, in effect, out of sight – and so out of mind. Because spending is automatically authorized every year unless some legislator proposes amending legislation to terminate a program, many of these policies are rarely revisited by the assembly once passed. As Delegate Poole puts it, such expenditure is “often not debated or otherwise subject to the ordinary trappings of the discussion process.”60 As can readily be imagined, this sort of approach to state budgeting does not lend itself to frugality. It is one of the reasons expenditure is so chronically high in Maryland.
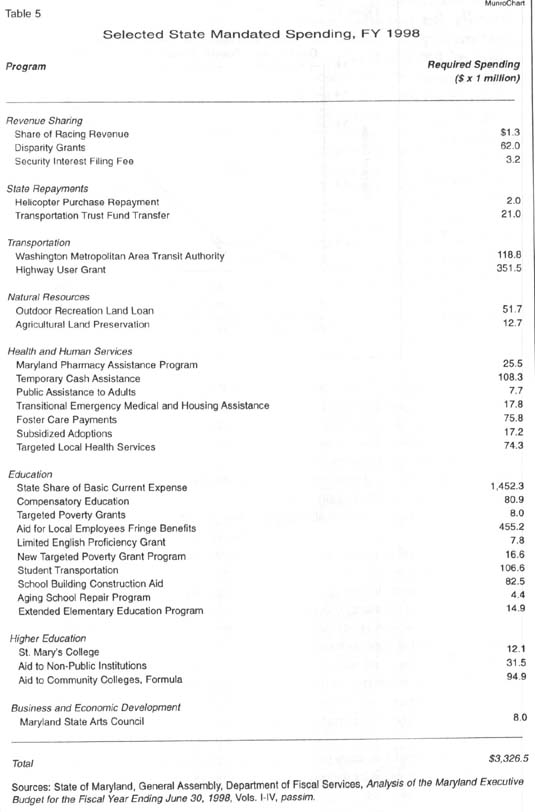
Observant readers will note from table 5 that a large proportion of mandated expenditure is on programs making payments to local governments. Examples include aid to community colleges and a vast array of K-12 education grants. So it is not surprising to find out that state assistance to local governments has increased relentlessly over the past few years. This is despite the fact that county governments in Maryland are relatively self-sufficient compared to their counterparts in many other states.
As previously described, few states permit local income taxation, an advantage for the purposes of local self-sufficiency. Collectively, Maryland’s local governments are above average in terms of self-sufficiency from all taxation sources, drawing local taxation equal to 4.8 percent of personal income, compared to 4.7 percent for local governments nationwide. In terms of income taxes, Maryland’s local governments receive income taxes representing 1.4 percent of personal income – far and away the highest rate of local income-tax return in the country. Among states permitting local income taxation, the average return as a percentage of personal income is 0.2 percent. The states whose localities that come closest to matching Maryland’s counties in income taxation are New York and Pennsylvania, for which local income taxation amounts to 0.8 percent of personal income.61
Maryland’s local governments can hardly be said to be experiencing fiscal pain currently. At the end of FY 1997 (that is, in June 1997), local governments were enjoying their largest aggregate general-fund surplus in a decade.62 This is evidenced by the fact that no county has increased local taxation recently. In fact, in FY 1998, four counties – Allegany, Carroll, St. Mary’s and Worcester – reduced their piggyback income taxes. At the same time, five counties – Caroline, Dorchester, Prince George’s, Queen Anne’s and, again, St. Mary’s – reduced their property-tax rates.63
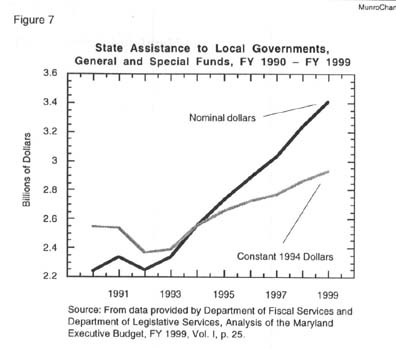
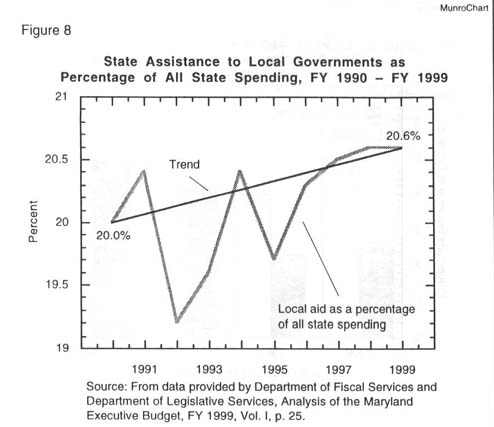
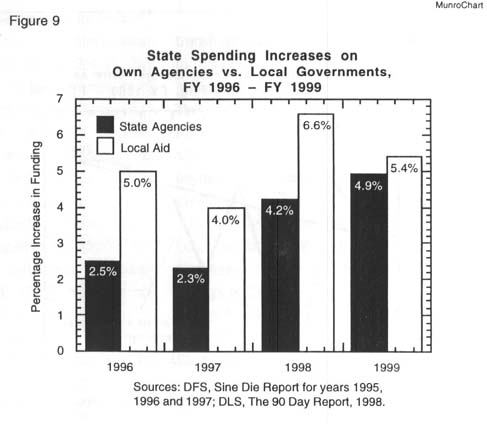
Regardless of the counties’ current fiscal bounty, as figure 7 shows, state payments to local governments have risen from about $2.2 billion in FY 1990 to some $3.4 billion in FY 1999 for an increase of 54.6 percent (or about $2.55 billion to about $2.95 billion in 1994 dollars for a real increase of 15.7 percent).64 As a percentage of all state spending, figure 8 shows that local assistance has fluctuated considerably over the past few years. This said, the trend has been upward, increasing from 20.0 percent of state spending in FY 1991 to 20.6 percent in FY 1999.65 Figure 9 shows that every year from FY 1996 through FY 1999, the annual increase in local aid has surpassed – sometimes substantially surpassed – the annual increase in spending on state agencies.66 A serious question should be posed in Annapolis: If local government coffers are now so flush with funds that local taxes can be cut, why, other than for electioneering purposes, is state expenditure on local aid increasing so rapidly?
As long as much of this aid is mandated by state law, and as long as local governments have no incentive to economize in the expenditure of such aid, the size of state government will not shrink without drastic action. Mandating severely restricts legislators’ budget flexibility, while escalating local aid results in a decoupling of the pleasure of spending (counties) from the pain of taxation (state), a recipe for runaway spending – an issue to which we return below. It is as much for these reasons as any that past attempts to rein in spending, such as those discussed in the next chapter, have failed so miserably.
V. The Previous Cures
The recession is over. “The good news is that some of the economic indicators for Maryland are finally upbeat. The bad news is that a return to financial health is likely to short-circuit steps to reorganize and shrink state government in Annapolis.” This observation was made by editorial writer Barry Rascovar in a 1992 Baltimore Sun opinion piece.67 His words are just as apt today as they were then. When times are good, touchy discussions about downsizing government seem somehow less important. Most assuredly, this state has not had – at least has not seriously had – such a discussion in years. In fact, as recently as May 1998, the administration’s recently resigned secretary of business and economic development said, “One of the mistakes we are very capable of making now is to assume that, because the economy is going well [currently], we’ve solved all of our problems.”68
The most important reorganization of state government since World War II occurred in 1969. That year, Maryland’s government was transformed from a fragmented system of 246 separate and autonomous units into a secretariat system, with agencies headed by a cabinet secretary answerable directly to the governor. The impetus for this change stemmed from the findings and recommendations of the Committee on Executive Reorganization, appointed by then-Governor Spiro T. Agnew (R) for the purpose of devising ways to streamline and modernize government functions. After Agnew’s departure to assume the United States vice-presidency, the committee’s recommendations were implemented under the administration of Governor Marvin Mandel (D), who succeeded Agnew.
The secretariat system, or cabinet form of government, began with the creation of four principal departments in 1969: Health and Mental Hygiene, Natural Resources, Budget and Fiscal Planning, and State Planning. In 1970, the number of departments increased by seven: Employment and Social Services, General Services, Personnel, Public Safety and Correctional Services, Licensing and Regulation, Transportation, and Economic and Community Development. The size and scope of state government has increased considerably since then. When Governor William Donald Schaefer (D) left office in January 1995, there were 16 departments and 43 agencies.69 The executive branch is currently made up of 16 main departments and no fewer than 79 independent agencies and commissions,70 which is to say that the number of these latter agencies has almost doubled over the past four years. (In addition, there are now 37 executive committees, task forces and advisory boards.)
There have been sporadic attempts since 1969 to implement further government reform. On September 12, 1991, executive order 01.011991.29 was issued by Governor Schaefer. This created the Governor’s Commission on Efficiency and Economy in Government, generally known as the “Butta Commission,” after its chairman, J. Henry Butta. Amid much fanfare, the Butta Commission was charged with:
- Conducting a review of state programs and operations with a view toward making recommendations for program elimination and general government downsizing;
- Conducting a review of management practices in state agencies with a view toward making recommendations to improve efficiency; and
- Examining and analyzing staffing patterns within state agencies with a view toward making recommendations to eliminate duplication and inefficiency.
Despite hard work and solid recommendations, the Butta Commission accomplished precisely nothing. Its 115 cost-saving recommendations were consolidated into 40 bills by the Schaefer administration, which between them would have saved taxpayers $40 million. But the General Assembly almost entirely ignored the Schaefer/Butta package, passing only a handful of the bills. “There was no reorganization of state government,” said Senator Laurance Levitan (D-Montgomery).71 “The legislature said they weren’t interested,” mourned Butta himself.72
Simultaneously, the then-speaker of the House of Delegates, R. Clayton Mitchell, Jr. (D-Kent), released a report describing a proposed reorganization of government which purportedly would have resulted in FY 1993 savings of $46.7 million.73 The effort went nowhere.
The assembly’s disinclination to heed the Butta or Mitchell recommendations led the following year, presumably during a brief period of shame, to the statutory creation of the Efficiency 2000 Commission, known as E2C. At the time, the Baltimore Sun correctly noted, “Ways have to be found to cut government spending….” It continued, again correctly, “But overcoming the opposition of powerful special interests and status-quo lawmakers will be a formidable challenge.”74
The following year, cuts were made – but only to E2C itself. Annapolis must have found itself uncomfortable with some of the issues discussed by E2C staff: that Maryland at the time was the only triple-A bond-rated state with absolutely no methodology whatsoever for public-sector performance measuring,75 for example, or that the state owned and operated 18 print shops when one would have sufficed.76 So during the 1995 legislative session, the commission’s staff was reduced from six to two and its funding was only extended for a further six months. No commission members were ever appointed. Then on May 5, 1995, the new governor, Parris Glendening, abolished the commission altogether (despite its not being slated for termination until June 30, 2000).77 In short, E2C never even got off the ground. Glendening then created the Governor’s Council on Management and Productivity, a group shortly to be criticized for inactivity by at least one state legislator.78
During the same legislative session, 1995, legislation was enacted to consolidate all major environmental regulatory permitting activities into the Maryland Department of Environment.79 Additionally, two existing agencies were abolished – only to be replaced by two new agencies with virtually identical functions. The Department of Economic and Employment Development and the Department of Licensing and Regulation were revamped as Department of Business and Economic Development and the Department of Labor, Licensing, and Regulation.80
A year later, during the 1996 session, legislation was enacted to merge the Department of Personnel with the Department of Budget and Fiscal Planning, resulting in the new Department of Budget and Management.81 Simultaneously, certain boards and commissions were consolidated and/or abolished. The 12 separate Public Defender District Advisory Boards were merged into four Public Defender Regional Advisory Boards. Nine other commissions were abolished altogether.82
Most recently, during the 1998 legislative session, an independent agency called the Office on Aging, descended from the 1959 State Coordinating Commission on the Problems of the Aging, was promoted to cabinet status and renamed the Department of Aging.83
Today, the state government structure of 16 principal departments and 79 independent agencies is certainly an improvement on the pre-cabinet form of government, when the executive branch consisted of 246 independent and separate units. However, we contend that the time has come for further change. Clearly, as this chapter has demonstrated, budget savings are not a priority in Annapolis. After all, if nothing serious has happened in almost 30 years, how committed can the state government be to internal reform? We believe the time for real reform is long overdue. The succeeding chapters of this report demonstrate how this may be accomplished.
VI. The Calvert Cure
In this chapter, we present our cure for the Maryland disease. We propose that all the budget reductions described in chapter VII of this analysis be used to pay off the state’s general-obligation debt. Readers may recall that, during the Reagan presidency, there was disagreement between tax cutters and “budget hawks.” The former saw tax reductions as the first concern of government. The budget hawks, on the other hand, considered reducing the country’s budget deficit to be a priority; tax cuts would follow later. We suggest that, if budget cuts of sufficient magnitude are made, Maryland can have both – debt reduction and simultaneous tax cuts. As long as annual reductions from baseline levels of expenditure are larger than proposed new borrowing, headway can be made – eventually reducing the debt to nothing. In the process of reducing the debt, debt-service payments are naturally reduced. It is by means of reduced payments on servicing the debt that we fund our tax cuts.
Our plan will allow Annapolis to have paid off its general-obligation debt in its entirety by fiscal 2007. At the same time, the plan will result in first-year tax cuts of $321.5 million, a figure that rises to just under $1.03 billion annually by FY 2007. We are not aware of such a plan having been devised for any other state.
As discussed in chapter III of this report, the continuing use of debt financing to pay for capital projects is an inefficient use of resources. From 1990 through the present, the state has increased its “credit card balance” from about $2.0 billion to $3.3 billion (nominal dollars).84 This refers only to general-obligation bonds, not to the various other state loans. At present, total state debt on all bonds – that is, general-obligation, transportation, capital-lease and stadium-authority bonds – is $4.7 billion, a figure set to rise to $5.2 billion by FY 2003.85 Unless otherwise specified, all references to “debt” in this and the next chapter are to general-obligation debt.
While virtually all Marylanders recognize the financial advantages of paying off their credit cards, Annapolis’ most recent “credit card” projections foresee an increase of over $1 billion in Maryland’s cumulative general-obligation debt by fiscal 2007, two gubernatorial terms from now. Under the terms of this arrangement, annual debt-service costs – i.e., the state’s minimum credit card payments – are predicted to reach $633.5 million, compared to $418.5 million in FY 1999.86 In the process, the taxpayer cost of each dollar of additional debt spent by the state will increase from $1.82 in FY 1999 to $5.25. This chapter describes why Maryland should get out of general-obligation debt and how it can achieve this while simultaneously generating considerable funds for income-tax cuts.
Our focus is solely upon general-obligation debt, probably the least potentially profitable of all the state’s forms of debt. There is a slender possibility that stadium-authority bonds for the construction of stadiums and convention centers may make a decent return one day. Likewise, there is nothing to prevent the use of transportation bonds to fund items such as toll roads, upon which the state might make some money back. General-obligation debt is generally used to finance everything else, from public-school capital projects to historical preservation to “community projects” to the endless and ongoing cycle of providing funds to local governments “where a state interest or need has been demonstrated” (the latter, a loose criterion, to be sure).87
The Annapolis Plan
The projected growth in general-obligation debt, as reported by the Capital Debt Affordability Committee, is presented in the table 6. The table is not as complicated as it looks. Line 1 (“debt at start of year, July 1”) shows the cumulative general-obligation debt outstanding at the beginning of each fiscal year under discussion. These figures are taken directly from the CDAC’s analysis. Line 2 (“new issues”) shows the amount of new debt Annapolis plans to add to the cumulative debt every year. Again, this is taken from CDAC data. Annapolis’ annual new issues of debt go toward two things: paying off old debt and funding new capital projects. These are reflected in lines 3 and 4. Line 3 (“redemptions”) shows how much of the funding realized from new bond issues Annapolis anticipates using to pay off old debt every year. Annapolis in part uses new bonds to pay off old bonds, rather like using one credit card to pay off another. Line 4 (“additional new debt”) represents annual new issues overall minus annual redemptions. This additional new debt is put toward the annual capital budget (which is in total made up of PAYGO funds, debt on other types of bonds, previously issued but not yet redeemed general-obligation bonds and the new general-obligation issues described in line 4). Finally, line 5 is the general-obligation debt outstanding at the end of the fiscal year, 12 months later. It is simply the sum of the start-of-year cumulative debt plus the net new issues over the year in question.
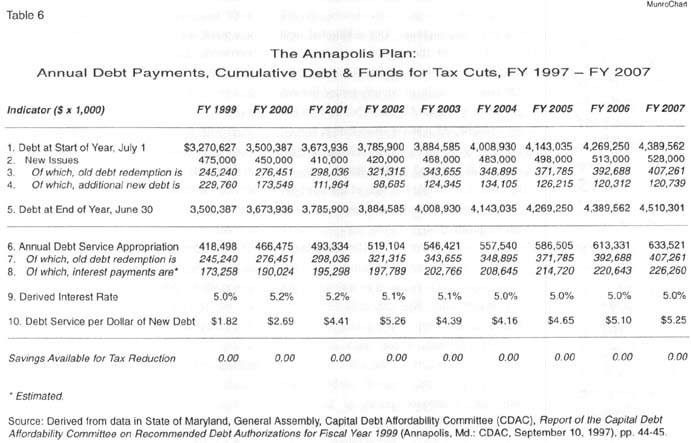
Moving on to the lower half of the table, line 6 (“annual debt-service appropriation”) shows the annual payment that is required as a result of the state’s past borrowing. Basically, debt service can be viewed as the required monthly minimum credit card payment. These data are taken directly from the report of the CDAC.88 Like a credit card payment, annual debt-service payments are composed partly of (a) some principal owed and (b) interest charges on all outstanding debt. Line 7 (“redemptions”) shows “a,” the principal redeemed. This figure is the same as line 3 in the top portion of the table. Knowing the debt-service requirements and knowing the annual redemptions, courtesy of the CDAC, allows us to subtract the second from the first to deduce “b,” the annual interest payments on Annapolis’ planned debt (line 8). From this, in turn, we can calculate the interest rate, which we find to vary between 4.9 percent and 5.1 percent (line 9). This is in accordance with historical data presented by the CDAC, which notes that for fiscal years 1995, 1996 and 1997, aggregate interest rates were 5.60 percent, 4.90 percent and 4.94 percent respectively.89
Finally, line 10 (“debt service per dollar of new debt”) is simply debt-service costs (line 6) divided by additional new debt (line 4). This gives us the ratio of new debt compared to debt service. For example, in FY 1999, additional new debt is $229.8 million and debt service is estimated at $418.5 million. The resulting ratio is 1-to-1.83, a crude measure of the cost of debt servicing to new debt, in this case $1.83 for every dollar borrowed. As the table shows, by FY 2007, Annapolis may be paying as much as $5.25 in debt-service costs for every new dollar borrowed and spent.
As with a credit card, the increasing balance owed (debt outstanding) has a proportional effect on the monthly credit card payment (annual debt-service payment). The more you owe, the larger your monthly minimum payment. In state government, the situation is no different. In FY 1999, Annapolis’ “yearly minimum” payment on its end-of-year debt of $3.5 billion will be $418.5 million. By FY 2007, the yearly minimum payment will be $633.5 million on a general-obligation debt load that will by that time have reached $4.5 billion. Because Annapolis has shown no inclination to control borrowing, the situation will escalate indefinitely after that. That is the Annapolis plan, such as it is.
The Calvert Cure
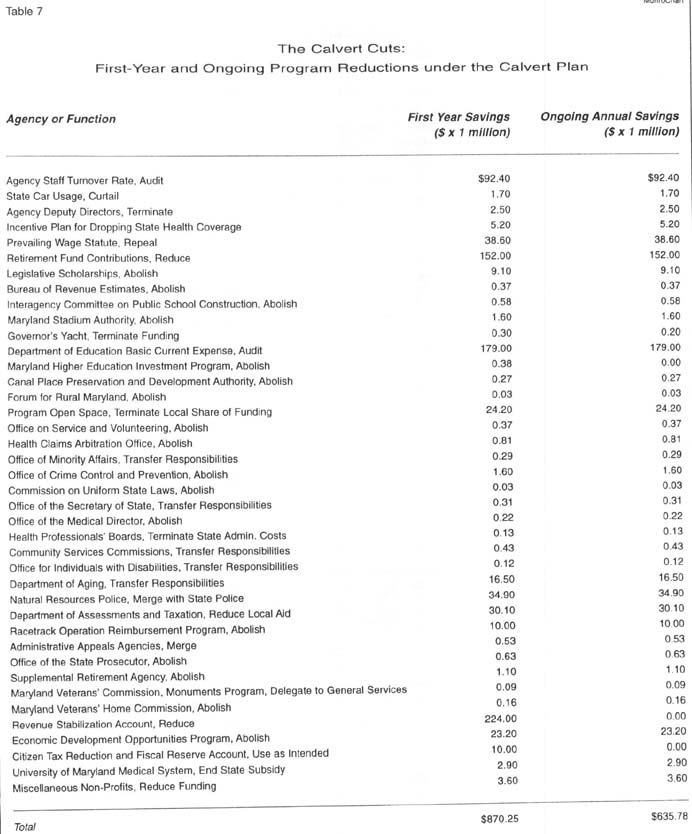
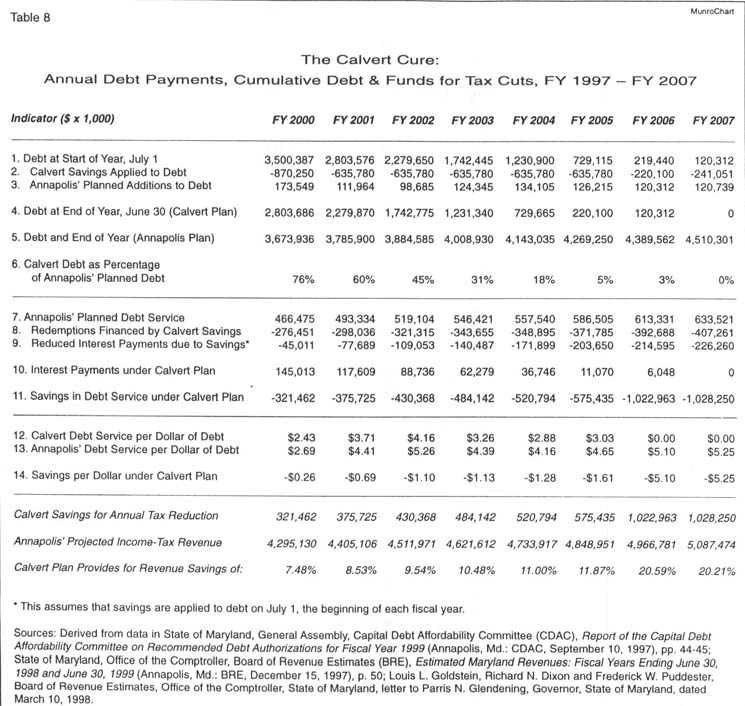
Instead, we propose something different, something daring. We propose to buy back every penny of state general-obligation debt while simultaneously providing millions of dollars’ worth of tax cuts. To accomplish this, we propose a first-year program reduction of $635.8 million plus a one-time transfer from the Revenue Stabilization Account of $224.0 million and the spending down of the $10.0 million in a little-known tax-reduction fund, for a combined debt-reduction package of $870.3 million. We then propose ongoing annual program expenditure thereafter set at $635.8 million below the current baseline, with the savings applied to debt reduction (total does not add up to detail because of rounding). A summary of our budget savings is shown in table 7 . The details are explained in chapter VII. Chapter VII provides a selection of cuts that could be made to finance the Calvert plan. It is not necessary that these be the actual cuts, though cuts of similar magnitude elsewhere would be necessary absent our suggested cuts. Our purpose is simply to raise ideas for serious discussion. (Alternatively, should Maryland realize significant revenue surpluses in the future, or should the state realize a significant windfall from any future legal settlement with tobacco companies, these funds could be utilized to achieve results similar to those described here.) Our plan as outlined herein would in its first year reduce state program expenditure by about five percent from baseline. Surprisingly, our plan retains many features of Annapolis’ planned expenditures, such as the general-obligation capital program, as shall be demonstrated below. The Calvert cure is described in table 8 .
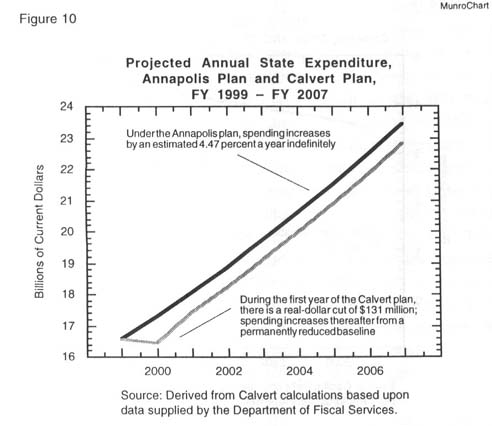
As shown in figure 10, under the Annapolis plan, state spending continues to grow every year, if precedent is anything to go by. From FY 1990 through FY 1999, state nominal-dollar expenditure increased by a weighted average of 4.47 percent a year. Projecting this growth into the future leads us to the assumption that by FY 2007 state expenditure will be $23.46 billion a year. Growth in government expenditure continues under the Calvert cure, too, but from a baseline permanently reduced by $635.9 million. Our first-year $870.3 million cut from baseline represents a real-dollar program cut estimated at $131 million, or a minuscule 0.79 percent, from the fiscal 1999 budget of $16.54 billion. Thereafter, we permit government growth at the same rate as under the Annapolis plan but from a permanently reduced baseline. Under the Calvert plan, state government spending would be $22.83 billion a year by FY 2007, a figure only 2.7 percent smaller than the equivalent figure under the Annapolis plan. Yet, our modest proposal is enough to get the state out of general-obligation debt completely and to provide the biggest personal income-tax reduction in Maryland history. The state should pay heed.
Our plan enters fiscal 2000 at the same place one would enter it under the Annapolis plan, with cumulative debt of $3.5 billion. (See line 1, “debt at start of year, July 1.”) However, instead of putting $245.2 million of new bond issues into debt redemption, as under the Annapolis plan, our cure sinks $870.3 million of program cuts and interfund transfers into buying back old debt. This is described in line 2 (“Calvert savings applied to debt”). Generously, we permit the state to borrow $173.5 million in new general-obligation loans for the capital program (line 3, “Annapolis’ planned additions to debt”). This is the amount of new borrowing the government anticipated putting into the capital program under the Annapolis plan. Because the Calvert cure pays off debt with real money, instead of with more borrowed money, by the end of fiscal 2000 our plan sees the state with a cumulative debt of $2.8 billion (line 4, “debt at end of year, June 30”). This compares very favorably with the Annapolis plan’s expected cumulative debt of $3.7 billion by the same time (line 5). As line 6 shows, Calvert end-of-year debt is only 76 percent of the state’s planned debt.
It just gets better after that. The Calvert blueprint has the state entering FY 2001 with outstanding debt of $2.8 billion. We pay off $635.8 million of old debt, while allowing the state to keep its planned general-obligation borrowing for the capital program. This process is then repeated thereafter, paying off $635.8 million of outstanding debt a year and allowing capital-program borrowing to survive entirely unscathed throughout. Maintaining this regimen results in the cumulative debt’s being fully paid off in FY 2007.
Tax Cuts
The substantial tax cuts we propose are financed entirely through the reduced debt-service costs that automatically come about under our plan, demonstrated in the second portion of table 8. For example, line 7 shows that in FY 2000 the Annapolis plan calls for $466.5 million in debt-service payments. Our cuts of $870.3 million automatically pay off the $276.5 million the state was planning to pay off anyway, though our plan does it with real money not borrowed money. Thus we automatically cancel the principal component of that year’s minimum payment. Our estimate is that this reduces the interest component by a further $45.0 million. In sum, interest payments under the Calvert plan come to $145.0 million for FY 2000, compared with $190.0 million under the Annapolis plan (table 6, line 8). The sum of Calvert redemptions and reduced interest payments is $321.5 million (line 11, “savings in debt service under Calvert plan”). Under the Calvert cure, personal-income taxation would be reduced by this amount. We then subtract this from Annapolis’ projected revenue for that year, enabling us to describe our cuts as a percentage of anticipated revenue.90 In this case, our first-year revenue reduction would be 7.48 percent. (These figures present our tax cuts in the most conservative light possible because state projections taking into account the accelerated Glendening tax cut resulting from 1998 legislation are not yet available. This acceleration will depress revenue relative to the projections we have utilized here, meaning that our program cuts would in actuality represent a larger proportion of a smaller budget. In short, our cuts as a percentage of revenue would in fact be slightly higher than described here.)
As this process is repeated in subsequent years, the difference between cumulative debt under the Annapolis plan and under the Calvert plan gets larger. Every year, the debt under the Calvert plan is smaller relative to the Annapolis plan and smaller in actual dollar amount. This being the case, annual debt-service costs become progressively smaller under our plan. We continue to determine our tax cuts by the size of the difference between debt-service costs under the Annapolis plan versus debt-service costs under the Calvert plan. This difference becomes larger every year, allowing annual tax reductions to be increased annually.
Under this scenario, some time during FY 2006, the debt is paid off entirely apart from a small amount of new debt necessary to fund the capital program. Once this has happened, we no longer need to put $635.8 million a year into debt redemption – because there is no debt left. Only a relatively small amount (some $120 million annually) is needed to maintain Annapolis’ capital program, so at this point we continue applying debt-service reductions to tax cuts but we also add in our now redundant debt-redemption payments. This results in a tax cut of $1.02 billion in FY 2006 and a cut of $1.03 billion by FY 2007. By FY 2007, the Calvert plan will have produced a tax cut equaling 20.21 percent of Annapolis’ projected revenue for that year. Our cuts as a percentage of revenue would escalate from this point on, though definite projections are difficult.
An alternative means of providing tax cuts to Marylanders would simply be to use our program savings for direct tax reductions, as opposed to leveraging tax cuts by means of debt purchasing. Despite initial appeal based on simplicity, this would over the long term produce tax reductions of smaller magnitude for residents. First-year tax cuts would be 20.3 percent of projected FY 2000 revenue. But by FY 2007, the cut would only be on the order of 12.5 percent of projected revenue ($635.9 million divided by $5.09 billion). From this point on, $635.8 million as a percentage of projected revenue would become smaller and smaller, resulting in tax reductions of an ever shrinking percentage. By contrast, under the Calvert plan, program cuts combined with savings due to the elimination of interest payments would result in reductions from projected revenue of well over a billion dollars a year.
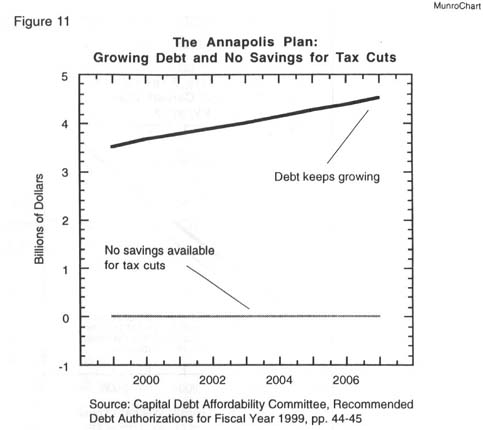
This is the Calvert cure. The radical difference between the Calvert plan and the Annapolis plan for debt upon more debt is vividly demonstrated in figures 11 and 12. As figure 11 shows, Annapolis’ plan for Marylanders is ever-higher debt and little else. Our proposal is for a reasonably painless way to eliminate the general-obligation debt and to produce a tax cut of a level unprecedented in Maryland history (figure 12). The Calvert cure promises relatively less government spending and a greater retention of hard-earned dollars for taxpayers. The Annapolis plan promises the exact reverse.
VII. The Prescription
In this final chapter, we present our specific recommendations for program cuts and other savings. As noted in chapter VI, these total some $870.3 million for the first year and $635.8 million a year thereafter. Implementing these cuts and savings would enable the state to buy back all outstanding general-obligation debt, thus freeing up hundreds of millions of dollars annually for tax cuts, funds that otherwise would have been necessary for debt-service payments. While our cuts are of significant magnitude, they are in fact very conservative. To the degree possible, we consider only savings to the general fund. For example, Maryland has no fewer than three health-care regulatory commissions located within the Department of Health and Mental Hygiene.91 While there is a case to be made for abolishing them, we do not consider them herein. This is because they are funded by means of fees levied upon the medical sector, with costs subsequently passed down to consumers. However, as terminating these commissions would not save general-fund moneys, this essay does not examine them. In some instances, however, funding sources are interwoven and state budget documents are not detailed enough to allow us to segregate them.
We are fully cognizant that the political opposition to our recommendations would be vast if a governor or legislator were to follow through on implementing them. We fully understand that every inefficiency has a constituency (often a very vocal and politically powerful constituency), while average taxpaying Marylanders are, for the most part, quiescent and uninformed. For Annapolis, the easy way out, then, is to maintain the status quo – however damaging.
We present here a variety of recommendations. Some are relatively inconsequential; some, of great consequence. Some are complex; some simple. While all of our recommendations will be opposed by someone, somewhere, some of our suggestions will be more controversial than others. For example, we recommend the termination of a number of the state’s many economic-development programs. Each will have its staunch defenders, no doubt, but nonetheless many reasonable people will, as a gut instinct, recognize that duplication in government is generally an undesirable trait.
On the other hand, other of our suggestions will engender colossal opposition, despite the fact that the particular situation in question is scarcely defensible as a matter of logic. The local education agencies’ apparently routine “over billing” of the state for mandated intergovernmental fund transfers falls into this category. We conservatively estimate that this over billing is to the tune of $179 million annually. Woe betide the politician who tried to remedy the situation, however. The public education establishment’s full political might would be mobilized in an instant. Thousands of dollars in campaign funds would be channeled to whomever the next opponent might be of the naive incumbent who dared to suggest that the mandated distribution of education funds should be based upon correct accounting by local public school systems.
Aware of this, Annapolis has done nothing effective in the past. We use the word “aware” advisedly and in a dual sense. Annapolis is aware of the opposition that reform would create, to be sure; hence, its inactivity. But Annapolis is also fully aware of much of the content of this report. A large proportion of our analysis is taken from the forest of paperwork annually released by the Department of Legislative Services – and inevitably ignored completely. Our estimates of the savings that would result from auditing local education agencies’ requests for transfer funds; our estimates for the saving to be gained from abolishing “prevailing wage” rules for public construction projects; our estimates of the savings that would be wrought from consolidating administrative-appeals agencies – all these we have derived from state government sources, usually the DLS. So why has the state done nothing in the past? Inertia, perhaps; and fear, no doubt.
In many respects, this is the most disturbing aspect of our findings – not the fact that the state routinely squanders millions of dollars annually on questionable priorities, but that it does so in the full knowledge that it is doing so. To be wrong in ignorance is one thing; to be wrong and fully aware of it is entirely another.
A. Cross-Agency Issues
The issues listed immediately below cannot be categorized by branch or agency because they impact all areas of state government. Below, and indeed throughout this chapter, our headings indicate, first, the government branch of the program under discussion (cross-agency, legislative, executive, etc.); second, the type of administering agency (cabinet department, independent agency, etc.); third, the category of program (state aid to education, for example); fourth, the actual program (basic current expense formula payments, for instance); and finally, after the colon, our recommended action.
At the end of each section is a savings tally with two figures. The first figure represents the first-year savings that would result from our recommended actions; the second, the on-going annual savings. For the most part, these two figures are the same. Occasionally, however, the first year’s action would result in savings that could not be replicated. In these cases, the second figure, for on-going savings, is shown as being lower than the first-year tally. Our figures for out-year savings are obviously speculative – and very conservative. We assume that programs would have continued to be funded at the same level. This is in fact unlikely. Program expenditures usually increase, especially for mandated programs. Our out-year figures in all probability underestimate the savings that would be brought about by implementing our recommendations.
Within the text of each section, we often present very detailed savings figures; for the end-of-section tallies we have for convenience rounded to one decimal place for figures of over one million. For figures in the thousands, we round to the nearest thousand. Given that the nature of government is always to spend more, not less, we have rounded all figures up unless the detailed number in question was only minutely above a whole number (in which case, we have rounded down).
A1. Cross-Agency Issue o Agency Staff Turnover Rate: Audit
The fact is this: Just as Maryland’s local education agencies appear to over bill the state for students that do not exist (see section CC1), so all the evidence indicates that government agencies are over billing the state for employees that do not exist. As with the schools’ over billing, legislators are perfectly well aware of this; they just prefer to do nothing.
In a February 3, 1993 press release, then-House Minority leader Ellen R. Sauerbrey (R-Baltimore County) drew attention to the need for correct accounting of departmental vacancy rates.92 This was important, according to House Republicans, because agencies were typically under reporting their vacancy rates, leading to higher-than-justified budget appropriations for salaries. The GOP members claimed that annual savings of $35 million could be realized if budgetary reductions were made based on a true accounting of vacant positions.
House Republicans identified “a number of different possible implications of such large unspent payroll appropriations: (1) whether this payroll appropriation accounts for the sums of money government agencies tend to ‘find’ when they want to undertake new projects; (2) if unused payroll appropriations have been spent offering certain employees raises via reclassifications; (3) if the administration intends to actually fill these positions; and (4) why such a large surplus of funds has not been shown in calculations of FY 1993 reversions.”93 To this day, the problem has not been addressed. Furthermore, the magnitude of the problem is almost three times as bad.
On any given day, in any given agency, a certain number of authorized positions are empty. Perhaps one employee has retired and a replacement has not yet been hired. For any number of reasons, there are always a number of vacancies. When making their budget requests at the beginning of the year, agencies take into account that there will be some vacancies during the coming year. They reduce their salary and benefits requests accordingly. The amount they reduce the request by is based on what is known as the “applied turnover rate.”
Naturally, no departmental secretary can predict with absolute certainty how many vacancies will occur over the year and how long each will go unfilled. Nonetheless, historical precedent could be utilized to make a good guess. But it generally is not. Because vacancies do not draw salaries, it is not in the interests of department heads to maximize the anticipated number of vacancies. The smaller the applied turnover rate, the larger the salary appropriation. If end-of-year salary funds are unspent, they can be used for other purposes. In fact, there is frequently a wide discrepancy between the applied turnover rate and the end-of-year “actual vacancy rate.” The appropriated salary funds that are then not spent on these “ghost” employees represent a windfall to the agencies. Annapolis is well aware of this situation. In April 1998, for example, the chairmen of the Senate Budget and Taxation Committee and the House Appropriations Committee demanded that the assembly increase the turnover expectancy of the Revenue Administration Division (RAD), an arm of the Office of the Comptroller, from 2.71 percent (as requested by the RAD) to 2.86 percent (a more accurate reflection of its actual vacancy rate of 3.14 percent).94
Though the language may be arcane, the extent of the situation is comprehensible enough even to the layman. For example, the FY 1998 salaries and benefits appropriation to the Governor’s Office for Children, Youth and Families was almost $2.3 million (shown in table 9a). At the beginning of 1997 (in anticipation of the July 1, 1997 start of fiscal 1998), the agency reported an anticipated vacancy rate of 4.58 percent, which became its applied turnover rate, shown in column 3 of the table. However, the agency’s vacancy rate over the course of the previous year, as reported on December 31, 1996, had been 25.6 percent. Why did an agency whose reported vacancy rate during 1996 had been over 25 percent then in January 1997 claim an anticipated turnover rate of just 4.58 percent for FY 1998? The answer is, because it was in the agency’s interests to do so. The agency’s appropriation was made on the assumption that on average 95.44 percent of its positions would be filled (100 minus 4.58). This was despite the fact that the previous year’s experience showed only 74.4 percent of positions to be filled on average (100 minus 25.6). The difference represented a boon to the agency of $482,421 in unspent salary moneys (assuming the actual turnover rate proved to be more akin to historical precedent than to the agency’s generous assumptions).
Tables 9a and 9b show the difference for FY 1998 between each major agency’s applied turnover rate and its actual vacancy rate for the previous calendar year. This is not a minor matter. The average applied turnover rate was 2.71 percent. Yet, the previous year’s overall average actual vacancy rate was 6.60 percent. All told, if agencies had at the start of calendar 1997 anticipated their vacancy rates for fiscal 1998 based upon precedent, then state expenditures would have been reduced by $93,008,960.95
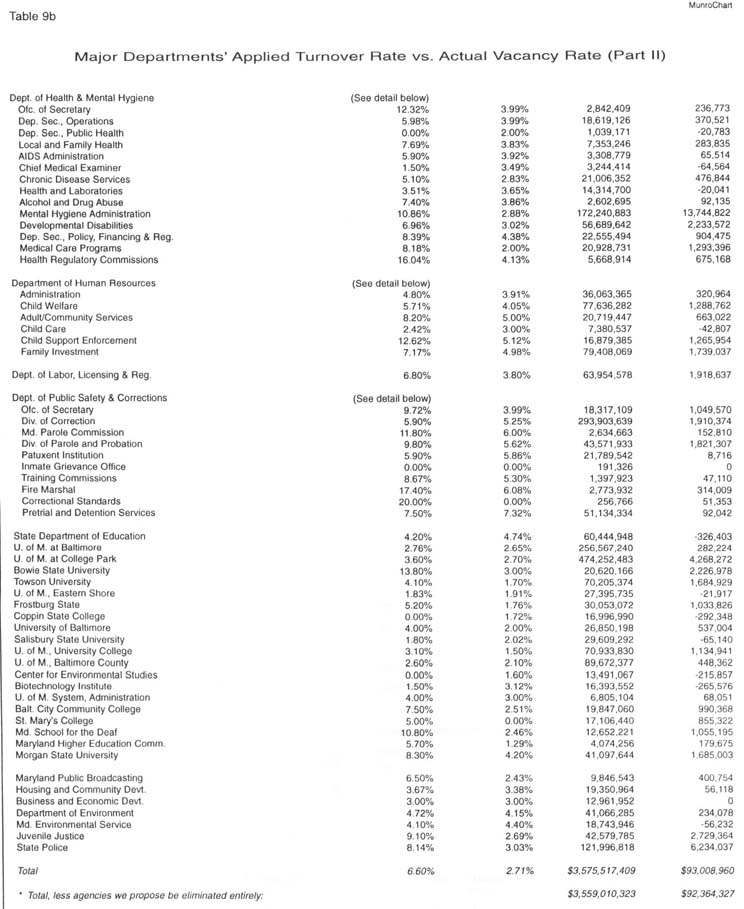
We propose that the legislature mandate that agencies utilize historical precedent in determining their anticipated vacancy rates – perhaps a rolling average of the previous three years’ vacancy rates. We suggest that this would significantly improve the reliability of anticipated vacancy data, leading to reductions in annual salary and benefits appropriations of the magnitude suggested above; that is, $93.0 million a year. From this, we subtract the agencies which this report recommends terminating entirely, so as not to double count savings, which results in net savings of $92,364,327.
Savings, First Year: $92.4 million
Savings Thereafter: $92.4 million
A2. Cross-Agency Issue – State Car Usage: Curtail
Here is an alarming fact: One out of ten state employees drives a state-owned vehicle. Granted, many of these users are perfectly legitimate users such as state police officers and transportation officials; granted many of the vehicles are heavy trucks and so forth necessary for state infrastructure purposes. Between them, the state police, the state Department of Transportation (DOT) and the University of Maryland system account for 60 percent of the state vehicle fleet. But what of the rest? Even more alarming is the open-ended authority afforded the secretary of the Department of Budget and Management (DBM) to make vehicle-assignment decisions.
For FY 1997, the costs associated with running and maintaining this fleet equaled $190 million for a vehicle tally of 10,700 vehicles.96 As shown in figure 13, costs escalated in real terms from FY 1993 through FY 1997 by 44.8 percent (from $119.8 million to $173.5 million in constant 1994 dollars). Of the $190 million in FY 1997 expenditure on the fleet, $42 million was attributable to cars, vans and light trucks (light vehicles). In real terms, light-vehicle expenditure increased by 7.3 percent from FY 1993 through FY 1997 (from $35.8 million to $38.4 million in 1994 dollars.) There are between 8,000 and 8,560 light vehicles, depending on the source.97 For the purposes of this section, we assume the lower figure of 8,000 to be correct.
The secretary of budget and management is required to adopt regulations that ensure the economical and efficient use of motor vehicles by the executive branch. This is handled by the department’s State Fleet Management Office, a unit tucked away within the Division of Policy Analysis. The office has implemented policies and procedures to govern the use and maintenance of all state vehicles. All three branches of government use these policies and procedures.
Under these policies, the following state officials and employees are authorized to be assigned a state vehicle:98
- Statewide elected officials;
- Staff of statewide elected officials, as approved by the governor;
- Cabinet secretaries and deputy secretaries;
- Heads of other departments and agencies, with the written approval of the secretary of budget and management;
- Appointed officials;
- State police, as specified by law; and
- Other state employees who meet the assignment criteria.
For the last group, the assignment criteria provide that vehicles may be assigned to state employees who travel more than 10,000 miles per year, unless the secretary determines that the use of a state vehicle is required for the efficient operation of a state program, regardless of miles traveled. This is at the sole discretion of the secretary.
Criteria for replacing vehicles is determined by DBM. Currently, vehicles must have at least 82,000 miles on the odometer before replacement. The fleet administrator may replace a vehicle after determining that its repair expenses have exceeded acceptable parameters. There is no specification as to what constitutes “acceptable parameters.”
In FY 1997, the DOT, the state police and the University of Maryland system were the largest users of state vehicles, with 3,200, 1,700 and 1,400, respectively. These three agencies accounted for some 60 percent of the state’s fleet. The judiciary had 39 cars in 1997. The Office of Legislative Audits, part of the Department of Legislative Services, had 18 vehicles.99 Given the FY 1997 nominal-dollar expenditure of $42 million on light vehicles, and assuming that the number of such vehicles is 8,000, this breaks down to annual an cost of $5,250 per light vehicle.
It is difficult to determine how many cars are associated with the obviously questionable usage categories, such as staff of statewide elected officials, heads of departments and agencies with written approval by DBM and other employees who are authorized by DBM regardless of the 10,000-mile criterion. However, we do know how many deputy secretaries have been granted the use of a state car – fourteen. These 14 deputies’ use of state light vehicles therefore costs state taxpayers $73,500 a year. (However, we do not factor these individuals’ usage in to our calculations below because, elsewhere in this paper, we have recommended abolishing deputy secretary positions anyway; thus by definition there would be no deputies to use state vehicles.)
As for other questionable users, we very conservatively assume two things: first, that all of the 60 percent of the fleet utilized by the state police, the DOT and the university system is truly necessary; second, that half of the remaining 40 percent is necessary also. That leaves us to suppose that 20 percent of light-vehicle usage is by users who do not really need state transportation. This means that, of 8,000 light vehicles, some 1,600 are used by agency staffers whom we do not believe merit such a perquisite. At $5,250 per vehicle, denying this privilege to such personnel would save taxpayers $8.4 million annually in direct costs.
We propose that state-owned vehicles not be authorized for staff of statewide elected officials, heads of departments and agencies or by the other employees approved by DBM on a case-by-case basis. (And there would be no deputy agency heads to use the cars either.) We anticipate that this would account for the 20 percent of fleet usage we consider unnecessary. This would save $8.4 million a year in direct costs. Instead, these personnel should use their own cars, being reimbursed at the standard federal rate of 28¢ per mile. We assume that between them the state vehicles currently used by these personnel travel some 24 million miles a year.100 At 28¢ a mile reimbursement, this would cost approximately $6.72 million. State taxpayers would therefore enjoy a net annual savings of $1.68 million.
Savings, First Year: $1.7 million
Savings Thereafter: $1.7 million
A3. Cross-Agency Issue – Agency Deputy Directors: Terminate
At present, every major department and agency of Maryland state government employs a deputy director or deputy secretary, many of whom do not have any particular defined job description. Some agencies have multiple deputy directorships. We question whether these positions are really justifiable or affordable. In table 10, we list 33 such deputy directorships. Between them, they cost the state $2.8 million a year in salaries alone, not including fringe benefits, vehicles and staff. Of the 33 listed here, the average salary is $84,937.
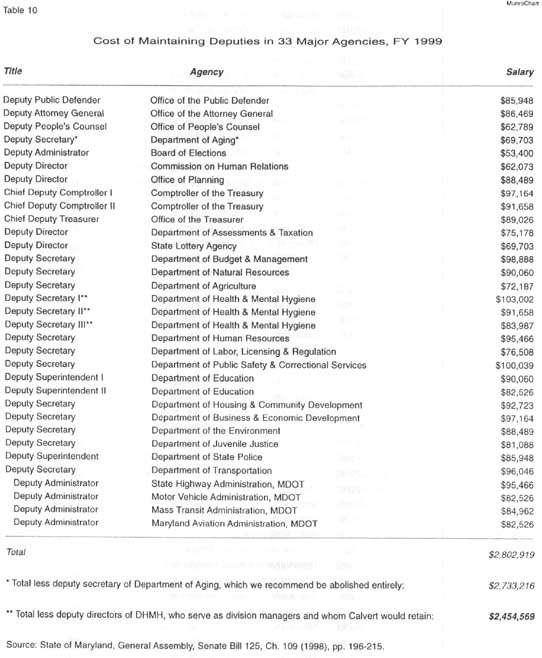
We recommend that the state seriously consider terminating these positions. We understand that deputy directorships represent prime patronage positions. Nonetheless, the interests of taxpayers must be put first. We cannot see that fiscal prudence is served by maintaining these personnel whose principal duty is to await the incapacitation of their superiors.
The traditional arguments made for retaining deputies, while not entirely without merit, are secondary to the taxpayer interests served by reducing expenditure. First, an agency needs a deputy secretary or director in case the incumbent vacates the position, so as not to compromise operational continuity. Despite the recent resignation of the secretary of business and economic development, Jim Brady,101 this is a rare occurrence indeed. Such turnover as does occur almost invariably happens solely during a change in gubernatorial administration, in which case the deputy directorships turn over as well.
Second, a deputy is needed in case the incumbent cannot be present during budgetary and statutory policy meetings and work sessions. However, this almost never happens. During the legislative session, General Assembly committees expect the top person to be present; his absence may well be taken as a sign of disrespect.
Third, a deputy is needed in case the incumbent cannot make a difficult decision. Despite this theoretical scenario, we are hard-pressed to account for a major policy change rendered by a deputy over an agency head. Deputy agency heads mostly perform administrative functions as directed by the secretary or director. Their functions are not set, for the most part, instead being determined by the top person. This may in some instances lend itself to a certain degree of make-work activity.
We exclude the deputy director of the Department of Aging’s salary of $69,703 because this is an agency we have eliminated elsewhere in this study. We also exclude the three deputy secretaries at the Department of Health and Mental Hygiene, who serve as division managers and whom we would retain. These exceptions aside, the annual savings to taxpayers in salaries alone that would result from abolishing the deputy directorships listed here would be $2,454,569.102
Savings, First Year: $2.5 million
Savings Thereafter: $2.5 million
A4. Cross-Agency Issue – State Health Insurance: Incentive Plan for Dropping State Health Coverage
In January 1992, the Department of Fiscal Services, or DFS (more or less the Department of Legislative Services’ predecessor agency),103 proposed an idea for legislative consideration. As with so many other DFS efforts, the idea went nowhere. However, it was a good one. It was to “encourage working spouses of state employees who are enrolled in the state health insurance plan to obtain health insurance coverage through their place of work.”104
The spouses of state employees are automatically eligible for the state insurance plan, provided the required employee contribution is made. Such state coverage is made available despite the likelihood that the working spouse is eligible for insurance through his or her own place of work. The company the spouse works for must annually budget for such insurance, even if the spouse does not utilize the coverage. The spouse is unlikely to be able to cash out the benefits.
The state government would realize significant savings if working spouses of state employees elected to take coverage for themselves and their children through their places of work rather than through the state. In 1992, the DFS proposed an incentive scheme to encourage them to do just this. The department suggested providing an incentive equal to 25 percent of the cost of covering the spouse and children. In other words, if the spouse and children dropped state coverage, the state would give 25 percent of the savings to the family, keeping 75 percent for itself. DFS projected a $5.2 million net savings to the state, based on its assumption of a 10 percent conversion rate.
We recommend that the state introduce this policy immediately. We conservatively assume that the DFS savings projections hold true to this day, though, given seven years of insurance-cost escalation, in fact the savings would probably be considerably higher.
Savings, First Year: $5.2 million
Savings Thereafter: $5.2 million
A5. Cross-Agency Issue – Prevailing Wage Statute: Repeal
A prevailing-wage law establishes minimum wage levels paid to workers on public works projects. Wages determined for these projects are intended to reflect wages “prevailing” within the locality. As a practical matter, this means union-set rates because, for the most part, prevailing-wage laws historically were enacted to protect local labor markets from wage depression and unemployment caused by the importation of lower-paid workers from elsewhere to construct public-sector facilities. Simply put, “prevailing wages” are union-set wages that are higher than those that would prevail under market conditions.
Maryland law requires that prevailing wages must be paid to workers on any public construction project receiving 50 percent or more of its funds from the state and valued at $500,000 or more. This requirement is in addition to the federal Davis/Bacon Act, passed in 1931, which requires that any state capital project funded in part with federal funds is subject to prevailing-wage regulations under the provisions of the act.105
Supporters of prevailing-wage laws for public works claim that such mandates assure a skilled labor force and, therefore, higher quality construction. Opponents counter that prevailing-wage regulations: (a) contribute to higher wage costs and therefore to higher overall costs, (b) cannot be equitably administered and (c) are costly to administer. Opponents continue that, even from the point of view of construction workers, prevailing-wage laws are unnecessary because there are other laws to protect employment and wages.106
It is true that repealing the state prevailing-wage law would not affect the federal requirement that union rates be paid on construction projects utilizing federal funds. Nonetheless, not all state capital projects receive federal moneys; such non-federally funded construction projects would thus be able to proceed at market rates. Some 32 percent of annual capital projects would be affected by the repeal of the state prevailing-wage law. Typically, two-thirds of the annual capital program is paid for by the state with the remaining one-third paid by local governments. The DFS estimates that construction costs on such projects could be reduced by five percent to fifteen percent.107 The state’s capital program for FY 1999 is $1.8 billion,108 a figure fairly similar to the previous year’s figure of $1.88 billion.109
If some 32 percent of FY 1998’s expenditure had been impacted by the repeal of the law ($602 million), then the state share of construction costs would have been reduced by $20.1 million to $60.5 million on an annualized basis.110 Additional savings would have been generated as the result of reduced debt-service costs because, if the cost of the state capital program had been reduced by repealing the prevailing-wage law, then the state would have needed to borrow less to finance the construction. Though such savings cannot be projected reliably,111 a 1991 DFS memorandum suggested tentatively, “As most of this financing is by debt, the savings in principal/interest payments would approximate $50 to $60 million over the terms of the bonds.”112 At minimum, we can say with certainty that these debt-service savings would be substantial.
Against these potentially major savings would be subtracted the small amount of revenue the state derives from fines levied against employers who do not pay union rates as mandated by the law, some $72,000 annually.113 However, this in itself would be more than compensated for by the reduction in state expenditure on monitoring prevailing-wage compliance. Absent state prevailing-wage legislation, the state could abolish the Prevailing Wage Unit within the Department of Labor, Licensing and Regulation. The unit had an FY 1998 budget of $156,542.114
The DFS suggests that abolishing the prevailing-wage law would save taxpayers five percent to fifteen percent on the costs of about one-third of the annual capital budget, which we here assume at a fairly constant $1.8 billion. (In turn, two-thirds of that would be a state-tax savings; one-third, a local-tax savings.) We herein “split the difference” and assume 10 percent savings on impacted construction projects, for approximate annual savings to the state of $38.6 million. (Local governments would save an estimated $19 million.)
Savings, First Year: $38.6 million
Savings Thereafter: $38.6 million
A6. Cross-Agency Issue – State Retirement Fund Contributions: Reduce
The funding system for state-sponsored employee and teacher retirement plans represents an excellent opportunity for controlling future state spending. The state’s current retirement plans were established in 1983. Since that time, the percentage of unfunded liabilities associated with the state’s retirement obligations has decreased from a high of 66.2 percent in FY 1984 to a low of 13.6 percent in FY 1997.115 This dramatic improvement in funding status has greatly exceeded the expectations of the state’s actuary, who has amortized the unfunded liabilities of the plans through the year 2020.
The recent improvement in the “balance sheet” of the pension plans presents an opportunity to curb or reduce future state spending. Expenditure reductions resulting from a change in the actuarial assumptions used to project the future status of the plans could reduce the annual appropriation made to the retirement funds. In short, current appropriations assume unnecessarily pessimistic rates of return on the pension funds’ investments. If appropriations were based more closely upon the actual rates of return of recent years, then less money would have to be appropriated to the pension funds every year.
Annual state expenditures for retirement obligations are determined by multiplying the annual retirement contribution rate, as determined by the state’s actuary, by the salaries of the employees who are enrolled in the state’s retirement plans. Each year, the actuary examines the actual “experience” of the systems and calculates the appropriate retirement contribution rate to be applied to salaries and wages for the upcoming year. This rate has steadily declined throughout the 1990s.
For FY 1999, the overall state contribution rate for the state’s retirement plans has been decreased by 1.23 percent.116 The Spending Affordability Committee (SAC) – a group made up of 18 state legislators, assisted by an advisory committee of four prominent citizens – estimates the savings resulting from this reduction to be on the order of $70 million.117 In other words, state spending for the state’s retirement obligations will decrease by $70 million in fiscal 1999 (including over $60 million in general funds). While this is encouraging news as far as taxpayers are concerned, we contend that the currently buoyant state of the stock market warrants further reductions in the state appropriation to the funds.
Recent analysis by the state’s actuary and findings of the board of trustees of the Maryland State Retirement and Pension Systems indicate that future reductions in state spending could be realized as a result of changes in the assumptions the actuary uses to develop the funding model for the plans.
The state’s actuary and the trustees of the pension systems have indicated that it would be appropriate to increase the actuarial rate of return used to value the systems’ assets from 7.5 percent to 7.75 percent.118 The actuarial rate of return is the rate of return the board estimates the pension funds will generate. In other words, a 7.75 percent actuarial rate of return is an assumption that the pension funds’ investments will generate 7.75 percent return a year. This would assume an increased investment return of $1.2 billion a year and an initial asset markup valued at $610 million.119 In turn, this increased (estimated) return would permit the state’s contribution rate for the systems to be reduced by 2.67 percent.120
If a 1.23 percent drop in the state contribution rate resulted in $70 million in savings, then a 2.67 percent reduction would reduce necessary appropriations by – i.e., save – $152 million annually. It is important that these gains be “captured.” During the 1998 legislative session, legislation was introduced to use this windfall to finance increases in the benefits paid to state employees and teachers. We contend that the state’s taxpayers represent a more deserving case. The funds should be utilized to buy back state debt, in turn resulting in reduced taxation.
Savings, First Year: $152.0 million
Savings Thereafter: $152.0 million
B. Legislative Branch
The legislative branch of Maryland’s state government is relatively small, so we have not tarried on its intricacies. However, one program cries out for termination, the annual assembly scholarships.
B1. Legislative – General Assembly – Legislative Scholarships: Abolish
Maryland taxpayers subsidize numerous scholarships. Spending for such scholarships will be $37.8 million in FY 1999. Among the most commonly criticized of these scholarship programs are those directly dispensed by the Senate and the House of Delegates, programs currently mandated by law. These will entail combined expenditure of $9,136,236 this coming fiscal year.121
We do not question the need for making education accessible and affordable. However, the Senate and House scholarships are widely reputed to be little more than patronage prizes. The program allows senators and delegates to provide scholarships to individuals without substantive requirements based on need or ability. Numerous legislative efforts have been made to abolish these two scholarship programs, or at least to establish objective requirements for the issuance of awards. None of these attempts has been approved by the assembly. In our view, these scholarships represent an unnecessary expenditure of public funds. We recommend the abolition of both these scholarship programs.
Savings, First Year: $9.1 million
Savings Thereafter: $9.1 million
C. Executive Branch
The executive branch of the government is naturally the primary focus of our report. It is here that the bulk of our savings are to be found, not surprisingly. We present our analysis divided, broadly speaking, by type. The types we have utilized are: (a) constitutional offices, (b) economic-development agencies, (c) education-related agencies, (d) environmentally or rurally related agencies; (e) the agencies under the auspices of the Office of the Governor; (f) agencies that are generally categorized as being in the area of “human services,” such as health- and welfare-related concerns; (g) public-safety agencies; (h) regulatory or fiscal agencies; and (i) any remaining agencies or functions, which we have placed in the “other” category. There will doubtless be quibbling as to how particular agencies should be classified. Should the Forum for Rural Maryland, for example, be placed in the economic-development category or the rural-and-environmental category? We have opted for the latter. At the end of the day, it does not really matter. Our classifications are for the reader’s convenience and nothing more, to break the monotony of reading what is, after all, ultimately an accounting document of sorts.
CA. Constitutional Offices
This section pertains to those offices explicitly authorized by the state constitution of Maryland.
CA1. Executive – Constitutional Office – Office of the Comptroller of the Treasury – Bureau of Revenue Estimates: Abolish
The Bureau of Revenue Estimates (BRE) is staff to the Board of Revenue Estimates, which is composed of the treasurer, comptroller and the secretary of the Department of Budget and Management (DBM). The board reviews the information and recommendations supplied by the bureau and submits to the governor an itemized statement of estimated revenues for the current and succeeding fiscal years.122 The governor then submits this to the General Assembly. The FY 1999 appropriation for the BRE is $371,513, which includes salaries, wages and fringe benefits for four positions.123 The members of the Board of Revenue Estimates have extraordinary personnel resources available to them, obviating the need for retaining the BRE. The comptroller, the treasurer and the secretary of budget and management have an army of professionals at their disposal who could perform the functions of the BRE. Additionally, the state’s universities maintain staff involved in this process. The BRE itself concedes as much. In a 1997 report, the bureau reveals a sampling of the other entities involved in the revenue-estimating process:124
In preparing these estimates, all of the state’s revenue-collecting agencies were consulted. In addition, the board continued to rely on the Revenue Monitoring Committee, made up of key state staff with revenue-estimating or -collection responsibility or knowledge, which it had appointed in 1992. The Committee compared and considered alternative economic forecasts made by economists at the University of Maryland and Towson University and by national consulting firms of Standard & Poor’s DRI and Regional Financial Associates.
The BRE’s functions should be reassigned to the DBM with cooperation extended by the offices of the Comptroller and the Treasurer. The bureau’s current personnel would be terminated. No new personnel would be added to DBM.
Savings, First Year: $372,000
Savings Thereafter: $372,000
CA2. Executive – Constitutional Office – Board of Public Works – Interagency Committee on Public School Construction: Abolish
The Interagency Committee on Public School Construction (IAC) provides staff support to the Board of Public Works for the administration of the public school construction program and the coordination of the activities of school-construction employees in the Maryland State Department of Education (MSDE), the Department of General Services and the Office of Planning. The committee assists local school systems and local governments in the planning, design and construction of educational facilities.125
Close scrutiny of the IAC operation raises an obvious question: Why do three other state agencies have to assist the IAC in the administration of Maryland’s school-construction program? For FY 1999, the IAC’s operating budget will be $583,453, including 10.6 full-time equivalent (FTE) permanent positions.126 Additional state moneys are budgeted to MSDE, the Office of Planning and the Department of General Services to assist the IAC in fulfilling its responsibilities. In FY 1998, this amounted to between seven and eight FTE staff – an estimated $325,000 in salaries and benefits.127 This situation constitutes a classic example of costly and unnecessary duplication in government.
We recommend that the IAC be abolished and that its responsibilities be transferred to those state agencies which currently assist the IAC, described above. No additional funds or personnel should be allocated to these agencies.
Savings, First Year: $584,000
Savings Thereafter: $584,000
CB. Economic Development
This section examines agencies involved in state economic development.
CB1. Executive – Economic Development – Independent Agency – Maryland Stadium Authority: Transfer Responsibilities to MEDCO
We contend that the state has unnecessarily over extended itself in creating two major state economic-development corporations (there are other, smaller ones, too, which we examine in the section on rural and environmental issues). These two agencies could better function as one – and at a much lower cost to taxpayers. This state does not need to retain both the Maryland Stadium Authority (MSA) and the Maryland Economic Development Corporation (MEDCO). We recommend the abolition of the former by incorporating its functions into MEDCO’s.
Opponents of a merger proposal would no doubt be vociferous in their arguments. They would point out that both have accomplished Herculean feats. The agencies, they would say, have distinct and separate missions. But do they really? Upon close inspection, it is clear that the MSA and MEDCO are both in business of stimulating economic development, mainly through the provision of technical expertise and financial assistance (the latter derived principally through their statutory authority to issue taxable and tax-exempt bonds).
MEDCO was created by the General Assembly effective June 1, 1984. Modeled in part after the Baltimore Economic Development Corporation, MEDCO is a state public corporation, the goal of which is to assist in the expansion, modernization and retention of existing Maryland business and to attract new business to the state. “The legislature, finding that Maryland needed but lacked direct property-development capability for economic-development purposes, established MEDCO to complement existing programs administered by the Department of Business and Economic Development’s (DBED) predecessor, the Department of Economic and Employment Development.”128
MEDCO receives no annual state appropriation. Seed money totaling $450,000 was appropriated to MEDCO at its creation. This “loan” was repaid by MEDCO by its fifth year of operation. Currently, MEDCO has one part-time and three full-time staff members. They are not public employees. MEDCO’s 1996 expenses were $11.6 million with administrative expenses of $324,351. Through the close of FY 1996, MEDCO had issued over $100 million in bonds for specific projects.129 (See table 11a for examples.)
The Maryland Stadium Authority was created in 1986 for the purpose of proposing a site for one or more new professional sports facilities in Maryland and financing and directing the acquisition and construction of such facilities. By statute, the MSA is authorized to issue tax-exempt revenue bonds, subject to the prior approval of the Board of Public Works.
From its humble FY 1986 beginnings of eight positions and a total budget of $521,000, the MSA has grown to a work force of 67 employees and a fiscal 1998 appropriation of $199.4 million,130 though for FY 1999 the budget is lower, $107.2 million.131 The MSA’s mission has also expanded. In addition to baseball and football stadiums, the authority has been utilized to develop the Montgomery County, Baltimore City and Ocean City convention centers. (See table 11b.) Critics contend that these projects are of questionable economic value to the taxpayers that provide their funding. Since its creation, the MSA has utilized over $870 million in taxpayer funding. It is not entirely clear why an authority created to manage stadium policy should have had its purview widened to include convention centers. And there is more. The MSA has recently announced plans to solicit proposals from developers for the development of an urban entertainment center – a multi-faceted leisure and parking complex – for the area between the Orioles’ and Ravens’ stadiums in Baltimore. The effort is currently on hold, pending the resolution of a dispute with the Orioles.132
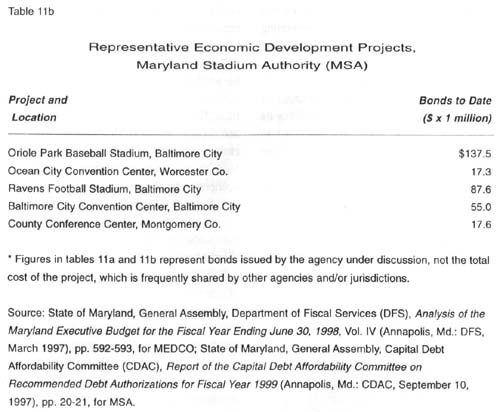
The obvious question is, how much larger is the MSA going to get? Through FY 1998, its staff had grown 737.5 percent since its inception; its budget, by 38,172.6 percent (current-dollar growth). This was not envisioned in the mid-1980s. The follow-up question must be, why does one public corporation need 67 state employees to fulfill its statutory mandate while the other, MEDCO, requires only four (three full-time, one part-time)?
With the completion of the football stadium, we suggest the abolition of the MSA, by now an “octopus with tentacles in everything,” according to state Senator Christopher Van Hollen, Jr. (D-Montgomery).133 The MSA is unlikely to be mourned by the public at large. A recent poll commissioned by the Baltimore Sun and three other media revealed that, even in summer 1998, a full 62 percent of Marylanders still resent the expenditure of taxpayer funds on the Ravens stadium.134 All the MSA’s functions, obligations and some personnel should be transferred to MEDCO. The long-term savings that would be realized are difficult to assess because the authority has obligated the state to certain ongoing commitments related to the aforementioned projects. Nonetheless, abolishing the authority would serve the taxpayers in two ways: (a) an immediate reduction in state spending resulting from the elimination of employees and attendant operating costs; and (b) a reduction in the temptation to embark on other projects of doubtful value. We propose the elimination of 50 percent of the MSA’s staff positions, with the remaining 33 personnel to be transferred to MEDCO. At minimum, this would result in an estimated savings of $1.6 million in salaries and attendant operating expenses.
Savings, First Year: $1.6 million
Savings Thereafter: $1.6 million
CB2. Executive – Economic Development – Cabinet Department – Department of Natural Resources – State Yacht: Terminate Funding
Despite being funded by the Department of Natural Resources (DNR), the governor’s yacht has traditionally been used for economic-development purposes.135 It is unclear exactly how much business the boat, Maryland Independence, generates. It is almost as difficult to ascertain how much it costs. The Independence is not granted a line-item entry within either the governor’s annual budget request or the annual enacted budget bill, though it is known that the ship is maintained by the DNR’s police force. The latter has 73 FTE positions and had an FY 1998 budget of $6.2 million. Of this, $2.2 million was general-fund money; $3.0 million, special-fund money; and just over $1 million, federal money.136 Finding out how much of this goes toward the boat is no easy matter. One must rely on telephone calls to Annapolis rather than on any printed documentation. FY 1999 expenditure on the upkeep and operation of the Independence will be $204,724, money which is put under the “general direction of the Natural Resources police,” according to one analyst.137 The drain on the budget presented by the Independence has been noted previously in Annapolis. During the 1997 legislative session, the DNR and DBED were directed to examine possibilities for the alternative funding of the boat’s operation, perhaps by means of a non-profit corporation.138 This option was later rejected. For a non-profit to have managed the yacht, it would have had to use the vessel for fund-raising purposes. This would have required repairs and retrofitting costing at least $200,000 to bring the vessel up to Coast Guard standards. The estimated sale value of the boat is only $150,000 to $200,000.139
Concerns about the practicality of spending $200,000 to repair a $150,000 vessel do not alter the fact that the state’s possession of the craft is costing over $200,000 a year. We thus recommend that the Independence simply be auctioned off to the highest bidder on an “as is” basis, with the purchaser undertaking all repair costs and utilizing the yacht for his own purposes. Even if the state realized very little from the sale, perhaps $100,000, taxpayers would be relieved of $200,000 in annual costs in future years.
Savings, First Year: $300,000
Savings Thereafter: $200,000
CC. Education
This section deals with issues pertaining to education, both at the K-12 level and higher education.
CC1. Executive – Education – Cabinet Department – Department of Education – State Aid to Education – Basic Current Expense: Audit
Maryland’s 24 schools districts do not have independent taxing authority, a privilege granted in many other states. Thus, state and local governments in Maryland share responsibility for funding the state’s public schools.140 Total local aid to education is some $3 billion a year. Most state aid to public education is mandated by law. For FY 1999, mandated local aid for education will total $2.41 billion, a $66.3 million increase over FY 1998.141 One component of state and local funding of the public schools is what is known as the “basic current expense,” the purpose of which is to provide a minimum level of support per student. The basic-current-expense formula provides about $3 billion annually to local education agencies (LEAs). The state provides approximately 50 percent of this funding, with the rest being provided by local governments by means of a matching formula. The formula provides for a flat-rate grant of a particular size per student. In FY 1997, the rate was $3,532, made up of pooled state and local funds, with the local contribution being determined by the relative wealth of the county in question.142 For FY 1999, the state’s component of the basic-current-expense formula will be some $1.5 billion.143
Maryland’s separation of functions between educational revenue raising (state and local governments) and revenue spending (LEAs) creates endless incentive for overspending by the LEAs because the pleasure of spending is divorced from the pain of taxation. Once disbursed to the LEAs, expenditure of basic-current-expense funds is no longer under the direction or control of the state government (or the county governments for their portion of the costs). Therein lies the difficulty in ensuring that the funds are expended in the most efficient manner possible.
Separating revenue-raising authority from spending authority creates public-policy problems. Typically, the spending authority is interested in maximizing the amount of funding it receives from the revenue-raising authority. The spending authority is likely to be oblivious to the impact of taxation on the statewide economy, the business climate or the competitiveness of the state in relation to other states. In addition, the spending authority is not involved in the resource-allocation problems confronting state officials as they juggle other interests’ demands on funding from the same revenue sources.
In the case of educational entities (both K-12 and higher education), this has become a serious problem because of the tremendous political influence enjoyed by advocates for education spending (teachers, administrators, university faculty, etc.). University faculty and teachers’ groups continuously pressure state officials for increases in funding and utilize their positions as government employees to advance their spending agenda. Despite the fact that 40 percent of Maryland State Teachers’ Association (MSTA) members’ expressing a preference are Republicans, some 90 percent of MSTA political contributions go to the Democrats.144 In the face of this orchestrated effort to increase spending, a large number of state and local elected officials find it politically impossible in a predominantly Democratic state to deny the funding requests of the educational establishment.
The strain between revenue-raising authorities and educational-spending authorities is frequently apparent when the local school boards submit their budgets to county officials for funding. Spring 1998 witnessed a particularly public spat between Anne Arundel County Executive John G. Gary (R) and county public school Superintendent Carol S. Parham. Gary was said to have intimated that Parham had submitted an especially large budget for school year 1998-1999 as a means of appeasing her school board and because of the impending election (when legislators were likely to be perhaps more generous than usual).145 Gary declined to grant the school board a spending increase of the magnitude it wanted. By summer, Gary found himself under political pressure to grant supplemental funds to the school district in order to blunt attacks by election opponent Diane R. Evans (D). Reluctantly requesting the county council to make an extra appropriation to the school district, Gary said with sarcasm, “Parents, teachers and county council members, maybe during the next 30 days, you can get the school system to answer with some reasonable satisfaction what these expenditures are for.”146 Such is the political influence of education interest groups that if elected officials do not provide the levels of funding requested by such groups, they can adversely impact an official’s re-election aspirations. As a result, many elected officials are loath to oppose the funding increases requested by educational groups or to attempt to impose any serious auditing requirements on the spending authorities. This situation is graphically illustrated by the situation described below.
One practical result of the Maryland’s taxing/spending separation when it comes to education is that a number of LEAs appear to be “over billing” the state by inflating their enrollment counts in order to win greater state (and local) moneys. A legislative auditor’s report of August 1996 indicates that perhaps more than $200 million in state and local aid to education is improperly distributed in this manner, a figure projected from the auditor’s random examination of records from five LEAs (Baltimore City and Frederick, Harford, Montgomery and Worcester counties).147 The report cited “numerous students reported twice and numerous students who never attended school.”148 The auditor had previously commented on deficiencies regarding enrollment counts, in April 1995, but no corrective action had been taken by Annapolis.149
The auditor estimated that three of the five LEAs audited could not substantiate from 10 percent to 26 percent of the students included in their enrollment counts for the purposes of intergovernmental fund transfers under the basic current expense formula. (Baltimore was the most modest offender, with 10 percent of students unaccounted for.150 The already lavishly funded Montgomery County was the worst offender, unable to explain 26 percent of students.)151 The degree of exaggeration of student head counts was great, as shown in table 12. Simply between the three of them, these three LEAs received between $59.7 million and $76.3 million more in state aid than they were entitled to (and up to $84.1 million more in local aid).152 Extrapolating from the auditor’s sample, student/teacher ratios and student/classroom ratios may be overstated by up to 26 percent statewide (though a somewhat lower figure is more likely).
These findings indicate that the purpose of the basic-current-expense formula is undermined by the lack of accuracy of the data utilized. Further, the use of this formula invites the inflation of enrollment counts so that LEAs may increase the amount of educational aid they receive from state and local governments. While education may be a priority, the generation of such of erroneous information – inflated enrollment counts – adversely affects lawmakers’ and taxpayers’ ability to evaluate the needs of the state’s public education system.
The auditor’s report seems to assume that this phenomenon is on-going. And the auditor presents no evidence that would lead one to assume it is not replicated in other LEAs across the state. Despite the release of the auditor’s report almost two years ago, no action has been taken to remedy the situation due to legislators’ reluctance to appear harsh on education. In fact, no effort has been made even to recover the funds from the three LEAs for which hard evidence exists. This is despite the fact that the auditor’s report was itself a follow-up to an earlier report, dating to April 1995. Since the 1996 auditor’s report, the legislature has again been reminded of the situation, in December 1997.153 Once more, no action. There is thus no reason to suppose that legislators will in the future develop any more interest in this issue than they have heretofore shown. Absent decisive leadership in Annapolis, the annual overpayment will thus in all probability continue indefinitely.
Nonetheless, the continued utilization of flawed data distorts the state’s spending priorities and places yet more burden on taxpayers. The 285,000 students included in the auditor’s sampling pool represented 38 percent of the state’s 1995-1996 total enrollment of 755,000 students. If the findings of the audited enrollment sample are applied as a ratio to the statewide student population, the amount of incorrectly distributed aid for education increases from a range of $60 million to $76 million to a range of $158 million to $200 million. This extrapolation indicates the potential magnitude of the problem.
We recommend that enrollment counts be audited annually prior to the distribution of state aid through the current expense formula. Assuming that the amount of incorrectly distributed funding is at about the midpoint of the possible range ($158 million to $200 million), then a correctly conducted annual audit followed by LEA compliance would save state taxpayers some $179 million a year.
Savings, First Year: $179 million
Savings Thereafter: $179 million
CC2. Executive – Education – Independent Agency – Maryland Higher Education Investment Program: Abolish
This agency was created by legislation in 1997 with a fiscal 1998 budget of $859,194.154 The mission of the Maryland Higher Education Investment Program (MHEIP) is to reduce the future indebtedness of students attending institutions of higher education. Having paid a $75 subscription, participants are entitled to invest money in MHEIP redeemable for future college-tuition payments for their children. Participants in the program are authorized to defer state taxes until their funds are used for educational purposes. While the intent of the program may have merits, a closer look at what the program provides clearly demonstrates its deficiencies.
Most notably, the program accomplishes nothing that could not be achieved by investing in any of the good mutual funds offered by private-sector brokerage houses – without the $75 up-front application fee. MHEIP does not guarantee the future payment of tuition, nor does the program offer minimum rates of return. “Investments are not backed by the full faith and credit of the state,” notes the DLS.155 In fact, the program simply offers participants the opportunity to save money for future educational use with reduced taxation on interest and dividend income from the invested funds.
MHEIP will operate a “financial services” company to invest taxpayers’ educational savings and to undertake a marketing campaign to generate assets for investment. The agency has a $1.2 million FY 1999 contractual services budget for “certain services including marketing, actuarial, investment management, banking and record keeping.”156 In other words, MHEIP will be contracting out all the “active ingredients” of its functions, leaving the six staff directly employed by the agency as middlemen and little more. The largest increase in its FY 1999 budget compared to its FY 1998 budget is for advertising. Appropriated advertising spending increased by $600,000 from fiscal 1998 to 1999, we assume due to the agency’s uncertainty about being able to attract customers.157
MHEIP’s budget is $1.85 million in fiscal 1999, of which $750,000 is a subsidy taken directly from the general fund.158 Eventually, MHEIP is expected to live off its own investments, without state subsidy, thus becoming a non-budgeted item. The subsidy was supposed to have been phased out at the end of FY 1998,159 but the agency’s inability to stand on its own two feet necessitated another year of support (FY 1999). It is quite possible that MHEIP will require future subsidy, in which case the agency will be a liability to the state. If it does survive on its own, its excessive middle-man features will prove a liability to participants in the plan, severely undercutting their returns relative to those that might have been made in the private sector.
There are numerous financial-services companies that can provide these same services without MHEIP’s high start-up costs. Further, we find no reason to believe that a state agency with six employees is going to be able to provide the level of investment expertise and administrative support that any professional investment company could provide. Additionally, there could be serious repercussions if the investment performance of MHEIP – taking into account the administrative costs generated by the agency – were to fall significantly below private-sector investment companies. There is no reason to believe that MHEIP will provide any significant benefit to the participants in the plan.
We recommend MHEIP’s termination. At minimum, all state subsidies should be canceled immediately. If the program cannot survive on its current investments, bankruptcy should be permitted to follow just as it would within the private sector. We recommend that the 1999 legislature rescind the appropriation made to MHEIP in 1998. We assume that by January 1999, about half of the $750,000 appropriation will have been spent. The remaining $375,000 should be returned to the general fund in 1999 and set aside for debt reduction in FY 2000. We take MHEIP at its word and assume that no subsidy would have been required in FY 2000, in which case our savings of $375,000 represents a one-time savings not replicated in future years.
Savings, First Year: $375,000
Savings Thereafter: $0
CD. Environmental and Rural Affairs
This section pertains to environmental, preservation and rural issues, including rural economic development.
CD1. Executive – Environmental and Rural – Independent Agency – Canal Place Preservation and Development Authority: Abolish
Created as an independent agency in 1993, the Canal Place Preservation and Development Authority has an FY 1999 budget of $268,356 ($205,000 in general funds; $63,356 in special funds).160 The authority’s mission is the development of the area adjacent to the Cumberland and Ohio Canal national park in the immediate vicinity of Cumberland in western Maryland.161 The authority has two FTE employees, costing $105,700 in salaries and fringe benefits.
We suggest that the authority’s development proposals are similar in nature to those driven by the Maryland Stadium Authority, which is to say that they are projects of questionable economic value to taxpayers. We certainly see no statewide benefit resulting from such purely local development. We believe that such initiatives should be promoted and financed by the relevant local government (namely, Allegany County) or possibly MEDCO. Thus, we propose the abolition of the authority before it becomes imbedded in state government.
Savings, First Year: $269,000
Savings Thereafter: $269,000
CD2. Executive – Environmental and Rural – Independent Agency – Forum for Rural Maryland: Abolish
The Forum for Rural Maryland – or “Forvm,” as it insists on calling itself – was established as an independent unit of state government in 1995.162 The Forum’s nebulous “vision” is to have “every rural community in marylnad [sic] have the capacity and means to create a place where there are opportunities for every person to live in material and spiritual well being.”163 We are not convinced that Marylanders’ spiritual well being is a legitimate function of government. The Forum’s more prosaic functions are to serve as a pass-through agency for various grants and as a clearinghouse on technological information.164
For FY 1999, the Forum has a budget of $144,783,165 including almost $104,000 in salaries and fringe benefits. Of this, $34,000 is general-fund money. Prior to being established as an independent unit of state government, the Forum’s functions, such as they are, were performed by the Department of Business and Economic Development, which is considered to be the Forum’s parent agency. The forum still receives staff assistance from DBED.166
 We do not believe that the functions performed by the Forum warrant the establishment of an independent unit of government. Its pass-through function could be performed by county governments. Its economic-development involvement and clearinghouse function could be performed by MEDCO or DBED. Thus, we propose the immediate abolition of the Forum before its takes on too permanent a status within the state government apparatus, saving $34,000 in general fund moneys per year.
Savings, First Year: $34,000
Savings Thereafter: $34,000
CD3. Executive – Environmental and Rural – Cabinet Department – Department of Natural Resources – Program Open Space: Terminate Local Government Share of Funding
Maryland’s Program Open Space (POS) is an almost 30-year-old program administered by the Department of Natural Resources. It has enabled state and local governments to acquire an estimated 200,000 acres for purposes of public recreation. POS has provided an estimated $600 million in public financial assistance since its inception in 1969. POS derives its revenue from the state’s property-transfer tax, a tax of 0.5 percent on instruments conveying title to real property. The transfer tax was in fact created exclusively to fund POS and to pay off the bonds issued to raise initial moneys for the program. Today, part of these revenues are retained by the state for the administration of POS and other programs discussed below; the rest is divided among local governments to enable them to purchase land for conservation or public recreation. The total direct appropriation to POS for administration for FY 1999 is $3,295,817, the vast majority of it from the transfer tax ($2,795,356). The program will also receive $461 from the general fund and $500,000 in federal funds.167 This is only the beginning. The POS program in FY 1999 will disburse $29.4 million on state public-recreation and related projects and will make grants totaling $24.2 million to local governments for similar purposes.168
As in so many other areas of Maryland government, POS suffers from the flaw of separating revenue-raising authority (the state, through the property-transfer tax) from spending authority (local governments, by means of their POS grants). Originally envisioned as a five-year undertaking, POS has managed to survive 29 years. However, it is time to rethink the necessity of retaining this program in its current form in view of the changes having occurred during the last three decades.
First, Maryland’s Agricultural Land Preservation Program (ALPP) emerged in the late 1970s and, like the POS, has principally lived off the state’s transfer tax ever since. To date, 128,445 acres of farmland have been preserved by means of the ALPP.169 When POS was created nearly 30 years ago, no one imagined that alternative and similar programs such as ALPP would exist.
Also, Maryland’s Rural Legacy Program was created by the 1997 General Assembly. This program “provides targeted funding for the preservation of the natural resources and resource-based economies of Maryland through the purchase of conservation easements and fee simple acquisition of land located in designated protection areas.”170 Like POS, Rural Legacy is administered by DNR. Rural Legacy represents a land-acquisition drive that will overshadow the efforts of POS – and in a shorter period of time. The state’s five-year funding projection for Rural Legacy’s land investments is $171.6 million ($115 million in general-obligation bonds, $5 million in general funds and $51.6 million in transfer-tax moneys.)171 By the year 2011, Rural Legacy is aiming to have protected 200,000 acres via conservation easement acquisition.172
As noted, Rural Legacy is funded in part by means of the state portion of the property-transfer tax. Rural Legacy’s dependence on the transfer tax reflects a deliberate policy started during the 1991-1993 recession to make the DNR less reliant on the general fund and more reliant on special-fund sources such as the transfer tax. Unlike POS, and reflecting the state’s shift in priorities away from recreational land and toward conserved land, Rural Legacy has found its way clear to having a base amount of annual funding enshrined by legislative mandate: “The governor shall include in the annual capital budget an amount not less than $5 million for this program [Rural Legacy].”173 As with the ALPP, Rural Legacy was not envisioned at the creation of POS.
Program Open Space is clearly no longer the only land-preservation game in town. Its proponents will argue that the ALPP and Rural Legacy have different aims from POS. The two former help protect land from private-use development, while the latter acquires land for the recreational enjoyment of Maryland’s expanding population. This is true. But there is a common denominator, the prevention of commercial and residential development.
The emergence of other state land-preservation programs drawing on the POS’s source of funding – the transfer tax – reflects an obvious shift in state policy priorities. The state now is more concerned with the purchase of land for preservation, not for public recreation. Given this new focus, we question the need for the retention of POS at all. However, given the popularity of preservation as a cause, we suggest instead the scaling back of the program by terminating its local-aid component.
State aid to local governments has increased in recent years, as described in chapter IV of this report. At the same time, most counties impose a local property-transfer tax, not unlike the state property-transfer tax. Given this, we see no reason to set aside POS funds to enable local governments to purchase land. Why not let local governments themselves decide if land acquisition for open-space purposes is a worthy policy priority? Could they not dedicate their own local property-transfer tax moneys for this purpose? If state assistance really is required, the counties may work through ALPP or Rural Legacy.
Whatever the verdict, a continued state subsidy for local open-space land acquisition is a questionable priority, inviting the sort of problems inherent when the spending authority (local governments) is not the revenue-raising authority (the state). (See section CC1 of this chapter on the Maryland’s K-12 “basic current expense” formula for distributing state moneys to local education authorities for an analogous situation.) If the state wishes to continue purchasing land through POS, let it; if the counties desire to purchase land for recreational purposes, they may use their own funds.
We therefore propose to eliminate the annual POS pass-through to local governments. The transfer tax would continue to be levied, but these funds would be earmarked for the general fund for the purposes of debt reduction. We assume that the state currently intends to fund the local component of POS at more or less the present rate for the foreseeable future. Terminating this aid would thus yield $24.2 million toward debt reduction.
Savings, First Year: $24.2 million
Savings Thereafter: $24.2 million
CE. Office of the Governor
Analysis of state spending by the many boards, commissions and offices tucked away under the auspices of the Office of the Governor is difficult due to their frequently substandard budget reporting. In 1997, the DFS noted that the “Governor’s Office, for the second year in a row, did not provide a budget document for each of the boards and commissions that provide[d] supporting detail and descriptions of items included in the budget electronic data base.”174 In FY 1998, the Office of the Governor had a federal fund revenue deficit of approximately $3.5 million.175 The matter was eventually resolved with the comptroller’s credit of a like amount in unclaimed federal funding to the office (funds received by the state but not accredited to any particular agency for various reasons).176 Despite the comptroller’s resolution of the problem, the matter still raises questions about the competence of the Office of the Governor to administer programs by means of the various agencies and so forth under its purview.
The General Assembly identifies several problems in its 1997 Joint Chairmen’s Report. First, the governor’s office’s “administration of federal grants has been less than satisfactory.”177 Second, because of major concerns regarding the Governor’s Office for Children, Youth and Families (OCYF), the joint chairmen requested a full management analysis of OCYF by September 1, 1997.178 A year later, the joint chairmen were still not satisfied with OCYF, prohibiting the office from expending funds on a data base until it had demonstrated to the assembly the need for the data base.179
In 1997, the joint chairmen were also concerned with excess contractual positions in the Office of Volunteerism (OV)180 and the Office of Crime Control and Prevention (OCCP).181 In 1998, the joint chairmen denied state funds to the OV for a federal matching requirement. Given the ongoing problems with these entities, we recommend that serious consideration be given to the abolition of certain program offices under the auspices of the governor.
CE1. Executive – Office of the Governor – Boards, Commissions and Offices – Office on Service and Volunteering: Abolish
We recommend the abolition of the new Governor’s Office on Service and Volunteering (GOSV), an amalgam of the OV and the Governor’s Commission on Service.182 While consolidation is generally desirable, the fact remains that the GOSV serves little practical purpose other than as a pass-through agency for federal Americorps funding to another agency under the purview of the governor, the Volunteer Maryland office. (Under federal regulations, the office that implements the Americorps program cannot be the same as the office that disburses the funds.)183 All other GOSV services are duplicative of services that are or could be provided by Volunteer Maryland. We recommend that GOSV be abolished and that some other agent be designated to receive and disburse Americorps funds. (The OCYF might serve as a suitable agent for the funds; it, like the GOSV, is primarily concerned with young people.) Along with over $7 million in federal pass-through funds, GOSV’s budget for FY 1999 is $366,983 in state general-fund expenditure for personnel, etc.184 Abolishing GOSV would save this amount annually.
Savings, First Year: $367,000
Savings Thereafter: $367,000
CE2. Executive – Office of the Governor – Boards, Commissions and Offices – Health Claims Arbitration Office: Abolish
The Health Claims Arbitration Office (HCAO), another little known agency nestled under the governor’s wing, provides a system of “mandatory arbitration of all medical malpractice claims in excess of $20,000.”185 However, the HCAO seems to be suffering declining effectiveness. The DLS says that most cases go to court anyway. Part of the office’s budget is made up of fees paid by would-be litigants, but the HCAO still draws over $800,000 in general-fund moneys a year. We recommend the termination of the HCAO. Its FY 1999 general-fund budget of $806,907 would thus be saved.
Savings, First Year: $807,000
Savings Thereafter: $807,000
CE3. Executive – Office of the Governor – Boards, Commissions and Offices – Office of Minority Affairs: Transfer Responsibility to Commission on Human Relations
According to the Department of Budget and Management, “The Office of Minority Affairs evaluates the impact of public issues and government-sponsored programs on minority communities and advises the governor on methods for providing positive impact and greater benefits to minority communities.”186 This may sound reasonable enough – until one realizes that there are two other executive-branch agencies with a similar mission. These are (a) the Community Services Administration within the Department of Human Resources and (b) an independent entity called the Commission on Human Relations.
We propose that the Office on Minority Affairs be abolished and that its functions be turned over the to human-relations commission, whose task, according to the DLS, is to promote “community relations and education to foster better understanding of Maryland’s anti-discrimination law.”187 With 49 FTE employees and an FY 1999 budget of $2.8 million,188 we have no doubt that the commission would be able to handle the Office of Minority Affairs’ work load with no increase in budget or personnel. The minority-affairs office has three personnel and a fiscal 1999 budget of $289,427.189 Its abolition would save about this much annually.
Savings, First Year: $290,000
Savings Thereafter: $290,000
CE4. Executive – Office of the Governor – Boards, Commissions and Offices – Office of Crime Control and Prevention: Transfer Responsibilities to Other Agencies
Already criticized by the assembly for excessive spending on contractual positions, the OCCP serves no purpose that could not be easily assumed by the Department of Public Safety and Corrections, the Department of Juvenile Justice and the Department of State Police. Its primary purposes are: (a) serving as a clearinghouse on crime-related research, which is probably unnecessary; and (b) formulating crime-fighting and delinquency-reducing public-policy strategies, functions better handled by the three departments listed above. FY 1999 general-fund expenditure on this office will be $1.6 million.190 Upon termination of the OCCP, its special- and federal-fund moneys would be reallocated to the above-referenced departments.
Savings, First Year: $1.6 million
Savings Thereafter: $1.6 million
CE5. Executive – Office of the Governor – Boards, Commissions and Offices – State Commission on Uniform State Laws: Abolish
The State Commission on Uniform State Laws is appointed by the governor to review Maryland and other states’ legislation with a view to identifying areas where uniformity of statutory language across states would be advantageous. The current commissioners are three lawyers: M. Michael Cramer (chairman), K. King Burnett and M. King Hill, Jr. There is also an associate commissioner, William G. Somerville.191
Though the annual appropriation to the commission is small, and though the mission of the commission is intellectually interesting, its purpose is hardly central to Maryland state government. Most of the commission’s budget is taken up by membership fees for the interstate association of such commissioners – the National Conference of Commissioners on Uniform State Laws (NCCUSL) – and on travel to and from the association’s meetings. NCCUSL’s aim may well be cerebral, but the fact is that the century-old organization has become just one of dozens of interstate organizations to which Maryland pays annual dues. Membership organizations to which various Maryland public officials belong include: the National Governors’ Association, the Southern Governors’ Association, the National Conference of State Legislatures, the American Legislative Exchange Council, the Southern Legislative Conference, the Southern Regional Education Board, and many others. The Maryland Manual gives a partial listing with 24 entries.192
Many of these organizations are duplicative. The NCCUSL’s principal occupation is the drafting of model legislation for adoption by all states.193 Another group, the Council of State Governments (CSG), also provides model legislation in the form of its annual Suggested State Legislation book.194 No doubt there is a case to be made for leaving CSG and remaining with NCCUSL. However, the state appropriation for NCCUSL is provided in the annual Maryland state budget, while its appropriation for CSG and the other membership organizations is not, which explains our concentration on the NCCUSL. The FY 1999 budget for the State Commission on Uniform State Laws is $32,485.195 The commission should be terminated, saving this amount annually.
Savings, First Year: $32,500
Savings Thereafter: $32,500
CE6. Executive – Office of the Governor – Office of the Secretary of State: Transfer Responsibilities to Office of the Lieutenant Governor
The secretary of state is appointed by the governor and has limited duties, primarily related to record keeping and regulating charitable organizations.196 The lieutenant governor is elected as part of the gubernatorial election ticket but has no significant required duties other than those delegated by the governor. We see no reason for Maryland taxpayers’ continued support of two positions with such limited roles. One would suffice. Seven states have no lieutenant governor. Another two have no secretary of state.197 In short, nine states have one official where Maryland currently has two. We recommend that Maryland become the tenth state to adopt fiscal prudence by eliminating one of these offices.
At first glance, it would make more sense to abolish the lieutenant governorship than the secretary of state’s position. The lieutenant governor is paid $100,000 annually, while the secretary of state receives $70,000.198 The secretary of state has some defined functions; the lieutenant governor has none. As in Arizona, the secretary of state could easily serve as next in line for the executive mansion in the event of the governor’s being disabled. However, we recognize that, as a matter of practicality, eliminating the secretary of state’s position would be easier than abolishing the lieutenant governorship. The lieutenant governor is a constitutional officer, while the secretary of state is not.
We thus recommend that the duties of the secretary of state be assigned to the lieutenant governor. Because both the secretary of state and the lieutenant governor have a state vehicle, several assistants and attendant supplies and office space, consolidating the functions of the secretary of state under the lieutenant governor would allow a reduction in spending equivalent to the salary of the secretary of state ($70,000), the salaries of several assistants (assumed at three positions with annual salaries of $50,000), fringe benefits (assumed at a rate of 30 percent), a vehicle and supplies and office space (estimated at $25,000). Other secretary of state personnel – such as those within the Division of State Documents – would be transferred to the lieutenant governor’s office. Based on these assumptions, state expenditures could be reduced by an estimated $311,000 per year.
Savings, First Year: $311,000
Savings Thereafter: $311,000
CF. Human Services
This section examines programs within the “human services” areas, a term which broadly speaking refers to services associated with health-care and welfare.
CF1. Executive – Human Services – Cabinet Department – Department of Budget and Management – Office of the Medical Director: Abolish
The DBM’s Office of the Medical Director, a four-employee office, ostensibly exists to conduct medical examinations of state employees to determine their “physical fitness to work in state service,”199 a function one might assume could perfectly adequately be carried out by privately practicing physicians. The state spends vast sums on health insurance for its employees. In 1997, the state enrolled no fewer than 90,114 people in its various health plans, at a cost to taxpayers of $294.4 million.200 We have no doubt that the many doctors participating in state health plans could easily assume the role of the state medical director by determining state employees’ fitness during their periodic check-ups. We recommend the immediate abolition of the medical director’s office. Its FY 1999 appropriation of $222,269 would thus be saved for taxpayers along with similar sums in the future.
Savings, First Year: $223,000
Savings Thereafter: $223,000
CF2. Executive – Human Services – Cabinet Department – Department of Health and Mental Hygiene – Health Professionals’ Boards and Commissions: Terminate State Administrative Support
Nearly all health-care professionals belong to one or more associations created for the purposes of regulating standards of conduct and regulating the standards of new entrants into the field. There is nothing necessarily offensive in this, other than to the degree regulation drives consumer prices up. However, less defensible is the expenditure of taxpayer funds on providing state staff to administer these boards. The boards in question are listed in table 13. They employ 158 Department of Health and Mental Hygiene (DHMH) administrators between them. As shown, the governor’s proposed expenditure for these boards in FY 1999 totaled $14,236,656. All but $126,045 of this was special-fund money, mostly fees levied by the boards upon their members.201 So most of the state employees are, in effect, paid by the boards. However, we question the need to spend even $126,000 in general-fund moneys to provide administrative assistance to well-heeled groups of professionals. We recommend the termination of this administrative support appropriation. The boards themselves can easily find this money within their own budgets, thereby funding their state employee administrators one hundred percent.
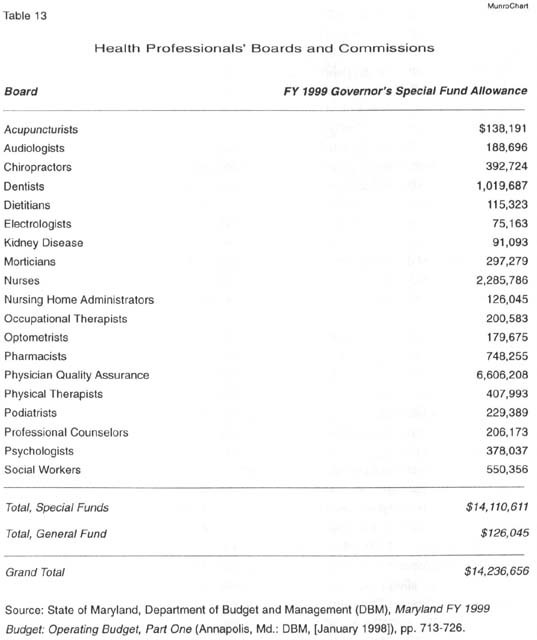
Savings, First Year: $126,000
Savings Thereafter: $126,000
CF3. Executive – Human Services – Cabinet Department – Department of Human Resources – Community Services Administration – Commissions: Transfer Responsibilities to Other Agencies
In addition to the Office of Minority Affairs and the Commission on Human Relations, discussed elsewhere in this report, the state government funds another four organizations with similar missions. Hidden away within the Department of Human Resources’ Community Service Administration are four commissions whose functions could easily be undertaken by the human-relations commission. These are the Maryland Commission for Women, the Governor’s Commission on Hispanic Affairs, the Governor’s Commission on Migratory and Seasonal Farm Labor and the Office on Pacific/Asian-American Affairs.202
We see absolutely no reason for taxpayers to continue annually diverting well over $400,000 to these groups. The Community Services Administration is already home to another women’s program, the Women’s Services Program (WSP). We suggest that the WSP should assume the responsibilities of the Commission for Women. Such functions as the migratory-labor commission possesses may be handled by the Department of Agriculture or the Department of Labor, Licensing and Regulation. Finally, all four groups are unabashedly described by the Department of Budget and Management as “advocacy” groups.203 The United States is home to any number of ethnic advocacy groups. It is not acceptable to expect Maryland taxpayers to fund four more. All four commissions should be terminated immediately, with their combined budget of $432,843 (FY 1999) reverting to taxpayers by means of debt reduction.204
Savings, First Year: $433,000
Savings Thereafter: $433,000
CF4. Executive – Human Services – Independent Agency – Office for Individuals with Disabilities: Transfer Responsibilities to Developmental Disabilities Administration
The Office for Individuals with Disabilities, a 12-employee agency, manages or staffs three principal programs: the Maryland Developmental Disabilities Council (MDDC), the Committee on Employment of People with Disabilities (CEPD) and the Technology Assistance Program (TAP).205 Noble though these efforts may be, we are concerned about duplication. There already exists within the DHMH something called the Developmental Disabilities Administration (DDA). There is no reason to suppose that the MDDC could not find itself a home within this administration, especially seeing as how much of its funding originates within the DDA.206
Meanwhile, federal funding for TAP is expected to end during fiscal 1999. The DLS is unclear as to whether or not TAP will be discontinued after federal funds have ended. If it is to be terminated, we concur; if not, we suggest that it should be, that the program be eliminated once these moneys have been exhausted.
With two of its programs thus ended or transferred, we do not consider it fiscally prudent to continue the operation of the Office for Individuals with Disabilities just to staff the CEPD. Therefore, we recommend that staff involved in this function be transferred over to the DDA also, which may if necessary broaden its focus slightly beyond developmental disabilities to all disabilities.
In sum, we suggest that half – i.e., six – of the Office for Individuals with Disabilities’ staff be transferred over to the DDA, along with salary moneys of $315,500 (half the current total).207 All federal funds would be transferred to or revert to the DDA. The rest of the Office for Individuals with Disabilities’ budget would be eliminated, accruing as savings to taxpayers through debt reduction. The FY 1999 net general-fund expenditure on the office will be $438,952. Less $315,500 in transferred salary funds, the annual net savings is $123,452.
Savings, First Year: $124,000
Savings Thereafter: $124,000
CF5. Executive – Human Services – Cabinet Department – Department of Aging: Transfer Responsibilities to DHMH
Established an independent agency in 1975, and descended from the 1959 State Coordinating Commission on the Problems of the Aging, the Office on Aging was during the 1998 legislative session converted into the cabinet-level Department of Aging.208 It has an FY 1999 budget of $33.1 million,209 including 48 positions and salaries and fringe benefits of $3.9 million. About half the agency’s budget is made up of federal funds, most of which are passed through to subgrantees.210 With average salaries and benefits of $75,312 per person, this represents one of the highest averages among all state agencies.211 The responsibilities of the office are described by the DLS as those “not designated by law to some other unit of state government,”212 which primarily means the DHMH.
We recommend that the Department of Aging be abolished and that any necessary functions be transferred to other units of government currently providing similar services, such as DHMH. As the recipient of Maryland’s Medicaid allotment from the federal government, DHMH has ample experience in dealing with federal moneys. There seems little reason to retain the Department of Aging as a pass-through agency in its own right for a mere $16.5 million in federal grants. With some 8,200 personnel, it seems likely that DHMH could assume the functions of the department with no increase in state funding or in staff. We propose the elimination of the Department of Aging, which would save $16.5 million in state funds annually.
Savings, First Year: $16.5 million
Savings Thereafter: $16.5 million
CG. Public Safety
This section examines issues revolving around public safety.
CG1. Executive – Public Safety – Cabinet Department – Department of Natural Resources – Natural Resources Police: Merge with State Police
Some accounts hold that crime in Maryland is decreasing. By any account, however, the state’s crime rate is still high compared to other states. With 948 violent crimes per 10,000 population in 1994, Maryland was the eighth most violent state in America that year.213 Given this, a piecemeal approach to policing cannot be considered acceptable. Budget language adopted by the 1997 General Assembly noted,214
Violent crimes and drug-related crimes are increasing and pose a significant threat to all communities, especially those communities with small local police forces unable to stretch limited resources to fight these types of crimes. The Department of State Police should develop a report which outlines policies for working in conjunction with local law enforcement agencies, particularly in combating violent and drug-related crimes.
As a step in this direction, we suggest the consolidation Department of State Police and the Department of Natural Resources’ police force, the latter a descendant of the state’s “Oyster Navy,” created in 1868 to prevent oyster poaching on the Chesapeake.215 Public safety is a primary goal of government, so combining these two police functions would send the right message to the citizenry and the criminal element. Merging of the two police forces was first proposed at the 1993 legislative session. The sole sponsor of the bill, H.B. 133, was Speaker Clay Mitchell. As the legislative text noted at the time, Marylanders want to see an increased presence of law-enforcement personnel; the state police and the Natural Resources police are the only two law-enforcement agencies vested with statewide responsibilities. Yet, the services they provide remain fragmented. In a special report released by Speaker Mitchell in January 1993, the following “perceived benefits of the proposed police merger” were identified:216
- Enhanced perception of accountability;
- Enhanced drug enforcement and interdiction efforts;
- Streamlining of administration, command and support positions;
- Shared academy and in-service training;
- Improved communications;
- Shared procurement;
- Shared regional offices;
- Shared motor-vehicle maintenance; and
- Shared contractual services.
Areas within the two police forces where economies-of-scale savings could be realized as the result of a merger are as follows. Within the Department of State Police, considerable savings would occur within the Office of the Superintendent, the Field Operations Bureau, the Bureau of Drug and Criminal Enforcement and the Administrative Services Bureau. As for the Natural Resources police, the bureau’s field operations section would not be anything like as costly. Total funds approved for FY 1999 in these areas are $174.3 million.
Speaker Mitchell’s 1993 report foresaw 20 percent overall savings from a merger of the two police forces. If merged at that time (1993), savings of about $22 million were expected. Based on current expenditure of $174.3 million, the savings now would be on the order of $34.86 million.
Savings, First Year: $34.9 million
Savings Annual: $34.9 million
CH. Regulatory and Fiscal Issues
This section looks at savings to be found within agencies concerned with regulatory and fiscal affairs.
CH1. Executive – Regulatory and Fiscal – Independent Agency – Department of Assessments and Taxation – Real Property Valuation Division and Business Services and Finance Division: Reduce Local Aid
State aid to local governments increases year after year, as discussed in chapter IV. For FY 1999, such aid will total $3.4 billion (including the costs of state-assumed local functions).217 Over the years, the state has assumed many of the functions typically performed by local governments. Purported reasons have included: (a) the idea that the particular functions were the state’s responsibility; (b) concerns that local administration and funding resulted in significant variances in the manner in which state law was administered; and (c) claims that local governments could no longer provide the financial resources needed to support the functions in question. The functions the state has assumed to date are:
- District Courts;
- Public Defenders;
- Property Assessment Offices;
- Washington Metropolitan Area Transit Authority;
- Homeowners’ Tax Credit;
- Mass Transit for the Baltimore Region;
- New Community College of Baltimore;
- Baltimore City Jail; and
- Baltimore City Central Booking Facility.
In 1991, the Department of Fiscal Services calculated that these costs would equal $571.5 million in FY 1992.218 This was the last time any agency made an examination of the costs of state-assumed functions.
We are here concerned with the local property-value assessment function conducted by the state. The valuation of properties is carried out by the state Department of Assessments and Taxation (DAT), which is considered to be an independent agency despite its cabinet-sounding name. All 23 counties, Baltimore City, over 150 municipalities and the state itself depend upon DAT to establish the assessable base upon which both state and local property taxes are levied. Real property taxes are collected by the local governments. The state property-tax portion is then remitted to the comptroller by the local tax collectors.
Each year, DAT values one-third of all real property in the state, with the other two-thirds being valued the following two years on a staggered basis. The valuation is based on a physical inspection prior to January 1 every year. Over a three-year period, all properties in the state are thus appraised. Any increase in the full cash value (market value) is phased in over the next three years. The phased-in full cash value is multiplied by 0.4 to determine the assessed value for each taxable year. (Assessments are based on 40 percent of market value in Maryland.)219
DAT’s total administrative budget for its Real Property Valuation Division and its Business Services and Finance Division for FY 1999 is $31.8 million.220 These two divisions are responsible for DAT’s assessment and accounting function. Given the perennial growth in state aid to local governments, outlined above, we wonder why local governments should not be required partially to share the state’s cost for performing this important function of government. It should be remembered that real property taxes are the primary source of revenue for most local governments in Maryland.
 We propose that the sharing of costs take place in the form of reduced aid to local governments. The DAT would still conduct the assessment function, but then local aid to counties, etc. would be reduced on a pro rated basis. That is, the ratio of each individual jurisdiction’s collection as a proportion of the overall collection would be calculated. This percentage would then be applied to the total state cost of the assessment function, some $32 million. Local aid would then be reduced by a like amount. To illustrate, if a given county’s revenue collection amounted to, say, four percent of the state’s total property-tax revenue collection for all jurisdictions, its local aid would be reduced by $1.28 million (which is four percent multiplied by $32 million). There is precedent for this. When the state took over Baltimore’s community college (FY 1991) and its jail (FY 1992), state aid to the city was reduced partially to offset the state’s increased costs.221
In FY 1993, local-government property-tax revenue amounted to $3.246 billion, which was 93.9 percent of the combined state and local property-tax revenue collection of $3.456 billion.222 We assume that this ratio holds more or less true to this day. Under the scheme described above, state assistance to local governments would thus be reduced by about 94 percent of $32 million, which is $30.1 million. By now, local governments collect over $3.7 billion in property-tax revenue annually, including an estimated $236 million in state property taxes per year. Property taxes are collected in advance. Interest earnings on $3.7 billion for six months at an interest rate of 5.45 percent are in excess of $100 million annually. There is no reason for local governments to complain about losing $30.1 million in state assistance.
Savings, First Year: $30.1 million
Savings Thereafter: $30.1 million
CH2. Executive – Regulatory and Fiscal – Cabinet Agency – Department of Labor, Licensing and Regulation – Division of Racing – Racetrack Operation Reimbursement: Terminate
The Division of Racing is a unit of the Department of Labor, Licensing and Regulation. The division regulates the horse racing industry in
Maryland. Last year, the state began a program of financing Maryland horse-racing tracks by including a $5 million appropriation to this program in fiscal 1998.223 This funding was in addition to the annual budget of $2.6 million for the Maryland Racing Commission and contractual employees. The fiscal 1999 budget doubles the FY 1998 giveaway by including a $10 million appropriation to Maryland’s tracks to pay the prize money and marketing expenses of track owners.224 We do not believe that taxpayers should be required to subsidize the racing industry, regardless of industry pleas that the installation of slot machines in Delaware and West Virginia is siphoning off gambling business. The combined pre-tax operating income for the Pimlico and Laurel tracks increased from $3.1 million in 1987 to $4.4 million in 1996, a nominal increase of 41.9 percent (or 4.5 percent after inflation).225 This does not seem to constitute evidence of a dying industry.
We propose that this subsidy be abolished, a subsidy that we also suppose the state currently plans to maintain indefinitely, at least at the $10 million level. As for political concerns that such an action would be unpopular, the average Marylander is unlikely to march on Annapolis demanding the reinstitution of the program. As of July 1998, no fewer than 61 percent of the public thought that Maryland racetracks should be left to take care of their own problems without taxpayer subsidy.226
Savings, First Year: $10.0 million
Savings Thereafter: $10.0 million
CI. Other Executive Issues
This section concerns itself with those executive functions not readily classified within the preceding sections.
CI1. Executive – Other Executive – Independent Agencies – Administrative Appeals Agencies: Merge
The General Assembly has for some time been aware of inefficiencies in the area of executive-branch appeals agencies, of which the state has a multitude. According to the FY 1997 budget bill:227
The Office of Administrative Hearings, Maryland Tax Court, Property Tax Assessment Appeals Boards and the State Board of Contract Appeals are agencies which provide administrative appeals of dispositions made by government agencies and taxing authorities. The [budget] committees are concerned that significant overlap in functions exist among those four agencies, which does not promote efficiency in government.
The DLS was directed to study the issue and report to the committees by October 1, 1997. DLS reported on schedule with the following recommendations:228
The potential merging of administrative appeals agencies is most plausible by merging the Maryland Tax Court and/or the State Board of Contract Appeals under the Office of Administrative Hearings. The estimated savings of abolishing the two smaller agencies and reclassifying only the necessary positions is $234,000 for the Tax Court and $294,000 for the State Board of Contract Appeals.
Though the DLS was naturally ignored by the assembly, we concur with its proposal, and suggest the immediate abolition of the Tax Court and the Board of Contract Appeals.
Savings, First Year: $528,000
Savings Thereafter: $528,000
CI2. Executive – Other Executive – Independent Agency – Office of the State Prosecutor: Abolish
The Office of the State Prosecutor was created in the mid-1970s to serve as a watchdog for state government by investigating and prosecuting public officials. It is considered an independent, executive-branch agency. However, as state employees, the staff members of the state prosecutor’s office are beholden to the very officials they are charged with overseeing. Therefore, the office lacks the independence necessary to fulfill its charge. This fact is documented in a budget analysis prepared for the General Assembly, noting that the press has charged that “the office has been politicized and cannot objectively perform its function.”229
The Office of the State Prosecutor typically looks into about 100 complaints annually, but many lead nowhere.230 Since the inception of the office, there have been questions as to why other state agencies have not been able to uncover scandals. The usual answer is that the prosecutor’s independence allows him to examine high-profile cases without political fallout. However, “many of his cases have been against small town or local elected officials around the state.”231 An unsigned analysis prepared by the Department of Fiscal Services in the mid-1990s noted that most of the cases raised by the Office of the State Prosecutor were not charges against political figures for sensitive issues but, rather, were simply charges against state employees accused of common theft and fraud offenses. As such, these charges were identical to those routinely filed by the Office of the Attorney General.232
The FY 1999 budget provides $621,501 for the Office of State Prosecutor.233 We recommend that this agency’s functions be assigned to the Office of the Attorney General and that the Office of the State Prosecutor be eliminated. The state prosecutor’s office currently employs one part-time and eight full-time personnel.234 With over 220 staff members at its disposal, we suggest that the Office of the Attorney General could easily absorb the work load of the state prosecutor’s office with no increase in authorized positions or funds.
There is certainly a possibility of politicization under our proposed scenario. However, we point out that the attorney general is elected independently of the governor, making him less dependent upon gubernatorial patronage than if the attorney general were appointed. Also, the Office of the State Prosecutor is already highly politicized. Republicans in the assembly recently claimed political motivation behind the prosecutor’s investigation of Howard County resident Linda Tripp for taping telephone conversations with Monica Lewinsky, the White House intern alleged to have had sexual relations with President William J. Clinton.235 We thus doubt that the situation in regard to politicization under our proposal would be any worse than is currently held to be the case.
Savings, First Year: $625,000
Savings Thereafter $625,000
CI3. Executive – Other Executive – Independent Agency – Teachers’ and State Employees’ Supplemental Retirement Agency: Abolish
With 13.5 FTE employees,236 the Teachers’ and State Employees’ Supplemental Retirement Agency provides state employees with the opportunity to take advantage of federal tax laws regarding the tax free accumulation of retirement resources.237
As its name suggests, the agency is supplemental to what may be termed the “regular retirement agency,” namely, the Maryland State Retirement Agency (MSRA). The MSRA administers the state’s defined benefit retirement and pension plans.238 The existence of these thoroughly duplicative agencies is a luxury Maryland cannot afford. In the course of their duties, each of these agencies performs a variety of overlapping data processing, accounting and marketing services. We believe that consolidating the functions of the supplemental agency into MSRA would result in savings equivalent to the supplemental agency’s entire annual operating budget. In FY 1999, this will be $1,049,708.239
Savings, First Year: $1.1 million
Savings Thereafter: $1.1 million
CI4. Executive – Other Executive – Independent Agency – Maryland Veterans’ Commission – Memorials and Monuments Program: Transfer Responsibility to Department of General Services
The Maryland Veterans’ Commission maintains 3.5 FTE employees to maintain two monuments in Baltimore City (Korean War memorial and Vietnam War memorial).240 (In July 1998, a World War II memorial was unveiled in Annapolis; however, its maintenance costs are not included in any budget books, so we have excluded it from this analysis.) Meanwhile, the Department of General Services (DGS) also contracts with the already vast city government to maintain a World War I memorial building and plaza in Baltimore.241 We suggest the immediate termination of the veterans’ commission’s memorial program. All salary funds should be terminated. Non-salary moneys should be transferred to the DGS, which would use them to pay the city to undertake the Korean and Vietnam monuments’ maintenance just as it does with the World War I memorial building and plaza. The veterans’ commission’s FY 1999 budget for the memorial program is $120,725.242 Of this, $93,432 is for salaries and benefits. We recommend the termination of this funding. The remaining $27,293 would be transferred to the DGS.
Savings, First Year: $93,500
Savings Thereafter: $93,500
CI5. Executive – Other Executive – Independent Agency – Maryland Veterans’ Home Commission: Abolish
The Maryland Veterans’ Home Commission has an FY 1999 budget of $6.7 million, including four positions and $157,635 in salaries and fringe benefits. This reflects an increase of one authorized position from last year, an additional clerk funded at $19,000.243 The commission provides no services itself. Its sole role is to oversee the private company that has the management contract for the Charlotte Hall Veterans’ Home, namely, Diversified Health Services, Inc.244 We do not believe it efficient or necessary to have a separate governmental unit exclusively to oversee this one contract. Therefore, we recommend that the commission be abolished and that contract oversight requirements be vested with the most appropriate other agency, the Maryland Veterans’ Commission, one or two of whose 17 personnel should be able to assume the home commission’s duties. We propose to eliminate the home commission’s personnel and to transfer all pass-through program funding to the Maryland Veterans’ Commission.
Savings, First Year: $158,000
Savings Thereafter: $158,000
D. State Funds
This section deals with two state funds, the so-called “rainy day” and “sunny day” funds, and with the Citizen Tax Reduction Fund. We propose that all three be utilized to benefit taxpayers.
D1. State Funds – Revenue Stabilization Account: Reduce
The Revenue Stabilization Account, otherwise known as the “rainy day fund,” was created in 1986. Due to concern over retaining the state’s triple-A bond credit rating, in 1993 the Spending Affordability Committee called for an increase in the balance of the fund to five percent of general-fund revenue.245 As a result, the balance in the fund has increased from $332,000 at the beginning of FY 1993 to a projected $632.4 million for the end of fiscal 1999, an increase of 190,381.9 percent in nominal terms (or 159,694.1 percent after adjusting for inflation). This $632.4 million balance for FY 1999 will exceed the five-percent threshold by $224 million.246 Figure 14 shows that the fund’s balance has been well over five percent of general-fund revenues since FY 1996.247
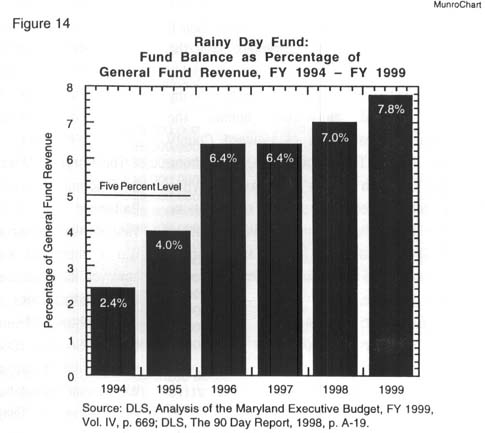
In part, it is debt and the associated need for a triple-A rating that dictate that the fund be kept at five percent or more of general-fund appropriations. A commitment to reducing the state’s outstanding general-obligation debt would result in a significant reduction in the need for maintaining a rainy-day fund balance equal to five percent of the general-fund revenues because less borrowing would reduce the imperative of securing a triple-A rating.
As Professor Barry Poulson notes, “The purpose of such rainy-day funds is to smooth out expenditures over the business cycle and for emergency expenditures. Excessive reserves, however, are an invitation to bloated spending. [A state’s] proposed cut in the income-tax rate should be designed to limit growth to planned expenditure levels, without expanding reserves.”248 Maryland’s reserves are now excessive. Thus, we propose that a portion of the rainy day fund be used to retire state outstanding general-obligation debt. We propose the immediate utilization of the excess $224 million – the amount by which the balance in the fund exceeds the five percent threshold – to reduce debt in fiscal 2000. Thereafter, the fund would be kept at five percent of general-fund revenues (though, if there were no debt, maintaining a triple-A bond rating would not be as vital as now, perhaps relieving the state of the necessity of keeping the fund even that high).
Savings, First Year: $224 million
Savings Thereafter: $0
D2. State Funds – Economic Development Opportunities Program Fund: Abolish
The Economic Development Opportunities Program Fund, generally known as the “sunny day fund,” was established in 1988. It is used to provide grants or loans to various private-sector entities for the supposed purpose of promoting economic development in Maryland.249 Over the past three fiscal years, $74.7 million has been appropriated to this fund, including an appropriation of $23.2 million in fiscal year 1999.250 This annual appropriation is, broadly speaking, quite constant from year to year.
We contend that the distribution of tax revenue to select private-sector businesses is not a legitimate use of taxpayer money. For a start, there is an inherent likelihood of politicization. This past spring, the governor authorized a grant of $500,000 to Radio One, a black-owned and
-oriented station traditionally supportive of Mr. Glendening. A very public dispute with the administration eventually led to the station’s refusal to accept the funds.251 The whole situation was a perfect example of the sort of unedifying spectacle inherent in the dispensation of taxpayer funds to government-selected companies. Additionally, there is also a constitutional case to be made that this sort of grant-making contravenes the state constitution’s lending-of-credit provision, under which public funds should not be permitted to benefit private parties (though such a discussion is beyond the scope of this report).252
We suggest that providing income-tax relief to all taxpayers and businesses is a more equitable method of promoting economic development. Thus, we propose that annual appropriations to this fund be discontinued and that the fund be abolished. This would save taxpayers something on the order of $23.2 million annually.
Savings, First Year: $23.2 million
Savings Thereafter: $23.2 million
D3. State Funds – Citizen Tax Reduction and Fiscal Reserve Account: Use for Intended Purpose
The almost entirely unknown Citizen Tax Reduction and Fiscal Reserve Account (CTRFRA) was created just after last election and then apparently – if predictably – more or less forgotten. The fund had an insignificant $10,010,322 appropriated to it in FY 1998.253 This represented the first time any funds had been put into the account. When the fund was created in 1995, the legislature directed Governor Glendening to transfer $190 million in FY 1996 rainy-day fund moneys to the CTRFRA. The governor refused to make the transfer, basing his action on an attorney general opinion that stated that the transfer could not be legislatively ordered by statute.254 The following year, the governor included a budget request for $26.5 million for the fund. This time, the legislature demurred, so no moneys went to the account in FY 1997.255 Finally, in FY 1998, $10 million was appropriated to the account. Currently, the administration plans to do away with the fund by FY 2000, transferring all moneys therein to the general fund.256
Instead, we propose that the CTRFRA be used for its intended purpose – tax cuts. We suggest that the $10 million currently in the account be “captured” and set aside for debt reduction, in turn leveraging tax cuts. Under this scenario, in FY 2000, the entire $10 million would be earmarked for debt reduction and the fund would then be abolished.
Savings, First Year: $10 million
Savings Thereafter: $0
E. State-Supported Institutions
The state government annually makes grants worth millions of dollars to various organizations, generally non-profit corporations. Many provide services the state would otherwise have to provide itself, so the state’s sponsoring of these organizations may represent a commendable instance of out-sourcing. On the other hand, other of these non-profits are of questionable value to the people of Maryland overall (though they may have local value).
E1. State-Supported Institutions – University of Maryland Medical System: Eliminate Annual Subsidy
The University of Maryland Medical System (UMMS) is a private, non-profit corporation created 1984. It manages the functions of the previously state-run University of Maryland Hospital.257 Though the UMMS is principally known for the R Adams Cowley Shock Trauma Center in Baltimore, the corporation manages a total of five medical centers (the James Lawrence Kernan Hospital, the Marlene and Stewart Greenbaum Cancer Center and the Deaton Hospital, along with University Hospital and Cowley Shock Trauma).258 The UMMS receives an annual state subsidy, which in FY 1999 will be $2.9 million.259
A case has been made for discontinuing the state subsidy.260 The justification for its continuation is the uncompensated costs frequently incurred by the Shock Trauma.261 All the same, the DFS last year suggested that the subsidy could no longer be justified if Shock Trauma’s services were folded in with the overall running of University Hospital. Indeed, the General Assembly directed UMMS to develop a plan for phasing out the subsidy as early as 1993. However, no progress has been made. The UMMS is understandably reluctant to have the subsidy eliminated. However, not only does the subsidy recoup the system’s losses on Shock Trauma, but in fact UMMS usually makes a slight “profit” on the transaction. From FY 1982 through FY 1997, the state’s subsidy to UMMS exceeded the system’s loss on Shock Trauma by an annual average $612,000.262 We recommend that the state subsidy to UMMS be ended.
Savings, First Year: $2.9 million
Savings Thereafter: $2.9 million
E2. State-Supported Institutions – Miscellaneous Non-Profits: Reduce Assistance
Language included in each year’s state budget notes the following: Funds will be made available to “provide annual grants to educational institutions which have statewide implication and merit state support.”263 These educational institutions are often non-profits. Many are entirely legitimate. Others, however, are disguised special interests. Often, it is hard to discern the “statewide implication” of the projects funded.
Funding for these fortunate few is not mandated by law; rather, it is subject to gubernatorial discretion. For FY 1999, the institutions receiving taxpayers funds are shown in table 14. The total is over $7.2 million. Given that many such operations do perform valuable community services, and given that many provide services that the government would have to provide for itself (probably less efficiently), we hesitate to recommend abolishing public funding for organizations such as these. Rather, we suggest providing assistance to such organizations on a 2-to-1 match; that is, $2 of their money for every $1 of taxpayer money. If the programs these organizations carry out are truly meritorious, it should not be impossible for them to locate foundation funds, contributions and local-government moneys. Such funding may then be matched by the state at a rate of 50¢ on the dollar.
Assuming that 50 percent of such organizations would opt to not receive state funding, or would be unable to qualify for it because of the absence of matching funds, annual savings would equal $3.6 million (further assuming that these organizations would have returned each year and received a like amount of funding).264
Savings, First Year: $3.6 million
Savings Thereafter: $3.6 million
Grand Total:
Savings, First Year: $870.3 million
Savings Thereafter: $635.8 million
End Notes
[Back] 1. Jay Hancock, “Md. Jobs Scene Tight,” (Baltimore) Sun, June 6, 1998, p. 1A.
[Back] 2. State of Maryland, Department of Business and Economic Development (DBED), Maryland Economic Development Commission, Strategic Directions for Increasing Maryland’s Competitiveness ([Baltimore, Md.]: DBED, [no date]).
[Back] 3. D. Bruce Poole, “When Our Fiscal Hands Are Tied: How Maryland Lost Control of Half Its Budget,” Calvert News, Vol. II, No. 4, Fall 1997, pp. 10-11, at 11.
[Back] 4. The term “local aid” refers to the state’s extensive annual transfer payments to Maryland’s county governments. The term “county” is inclusive of Baltimore City, an independent unit of local government unaffiliated with any county.
[Back] 5. State of Maryland, Capital Debt Affordability Committee (CDAC), Report of the Capital Debt Affordability Committee on Recommended Debt Authorizations for Fiscal Year 1999 (Annapolis, Md.: CDAC, September 10, 1997), p. 44. (Hereinafter CDAC, CDAC Report, FY 1999.)
[Back] 6. State of Maryland, General Assembly, Department of Legislative Services (DLS), Analysis of the Maryland Executive Budget for the Fiscal Year Ending June 30, 1999, Vol. IV (Annapolis, Md.: DLS, March 1998), p. 654. (Hereinafter, DLS, Analysis, FY 1999.)
[Back] 7. CDAC, CDAC Report, FY 1999, p. 43.
[Back] 8. State of Maryland, General Assembly, Department of Legislative Services (DLS), Effect of Long Term Debt on the Financial Condition of the State (Annapolis, Md.: DLS, November 1997), p. 52.
[Back] 9. State of Maryland, General Assembly, Spending Affordability Committee, Report of the 1997 Interim (Annapolis, Md.: Department of Legislative Services, December 1997), p. 28.
[Back] 10. Editorial, “Tax Cuts, Anyone?” (Baltimore) Sun, March 15, 1998, p. 2F.
[Back] 11. Spending Affordability Committee, Report of the 1997 Interim, p. 64.
[Back] 12. Spending Affordability Committee, Report of the 1997 Interim, p. 64.
[Back] 13. From data provided by State of Maryland, General Assembly, Department of Legislative Services (DLS), for FY 1990-96; also DLS, Analysis, FY 1999, Vol. I, p. 35, for FY 1997-99.
[Back] 14. Barbara A. Hoffman, Chairwoman, Committee on Budget and Taxation, Maryland State Senate, General Assembly, State of Maryland, and Howard P. Rawlings, Chairman, Committee on Appropriations, House of Delegates, General Assembly, State of Maryland, letter to Marita B. Brown, Secretary, Department of Budget and Planning, State of Maryland, dated January 26, 1996.
[Back] 15. State of Maryland, General Assembly, House of Delegates, Committee on Ways and Means, Report of the House Ways and Means Committee on Tax and Fee Issues (Annapolis, Md.: Department of Fiscal Services, September 1996), p. 124.
[Back] 16. [Barry Poulson], “A Study of State and Local Government Fiscal Restraint Mechanisms, Part I: State Fiscal Policy & State Tax Systems, and Analysis of Fiscal Discipline,” National Tax-Limitation Foundation Special Project [no date], p. 8.
[Back] 17. House Committee on Ways and Means, Report of the House Ways and Means Committee on Tax and Fee Issues, p. 120.
[Back] 18. U.S. Data on Demand, Inc. and State Policy Research, Inc. (USDD/SPR), States in Profile: The State Policy Reference Book, 1995 (McConnellsburg, Pa.: USDD/SPR, 1995), table D-4.
[Back] 19. Congressional Quarterly, Inc. (CQ), Governing: Sourcebook, 1997 (Washington, D.C.: CQ, 1997), p. 35.
[Back] 20. American Council on Intergovernmental Relations (ACIR), Significant Features of Fiscal Federalism, Vol. 2: Revenue and Expenditures (Washington, D.C.: ACIR, October 1997), pp. 92, 98, tables 47 and 50.
[Back] 21. William S. Ratchford II, Executive Director, Department of Fiscal Services, General Assembly, State of Maryland, letter to Senate President Thomas V. “Mike” Miller, House Speaker Casper R. Taylor, Jr., Senators Clarence W. Blount, Barbara A. Hoffman, William H. Amoss, Ida G. Ruben, Thomas L. Bromwell and Delegates Thomas E. Dewberry, John A. Hurson, Howard P. Rawlings, Nancy K. Kopp, Sheila E. Hixson and Robert H. Kittleman, dated November 20, 1996, p. [1].
[Back] 22. Ratchford, letter to Miller et al., p. [4].
[Back] 23. DBED, Strategic Directions for Increasing Maryland’s Competiveness, ch. III, p. 9.
[Back] 24. Thomas W. Waldron, “State Leaders Agree on Plan for Tax Relief,” (Baltimore) Sun, April 9, 1998, p. 1A.
[Back] 25. David F. Roose, “Income Tax Reduction,” Department of Legislative Services Fiscal Note, April 30, 1998, p. 1.
[Back] 26. Roose, “Income Tax Reduction,” p. 1.
[Back] 27. DLS, Analysis, FY 1999, Vol. IV, p. 672.
[Back] 28. All data taken from Ratchford, letter to Miller et al., pp. [1]-[4].
[Back] 29. Waldron, “State Leaders Agree on Plan for Tax Relief.”
[Back] 30. For more on this issue, see Barry Rascovar, “Anti-Business Reputation May Hurt Glendening,” (Baltimore) Sun, May 31, 1998, p. 3F.
[Back] 31. DBED, Strategic Directions for Increasing Maryland’s Competitiveness. The reference to “red flags” is in ch. II, p. 9.
[Back] 32. CDAC, CDAC Report, FY 1999, p. 44.
[Back] 33. DLS, Analysis, FY 1999, Vol. IV, p. 654.
[Back] 34. This assumes there to be 2.55 million taxpayers in Maryland. Data derived from U.S. Department of Commerce, Bureau of the Census, County and City Data Book, 1994 (Washington, D.C.: Government Printing Office, August 1994), p. 263, table B, item 125.
[Back] 35. The debt-service figure reported in winter 1998 issue of the Calvert Institute’s Calvert News journal was $423.5 million, taken from State of Maryland, General Assembly, Department of Fiscal Services (DFS), Analysis of the Maryland Executive Budget for the Fiscal Year Ending June 30, 1998, Vol. IV (Annapolis, Md.: DFS, March 1997), p. 716, exhibit 1. (Hereinafter, DFS, Analysis, FY 1998.)
[Back] 36. CDAC, CDAC Report, FY 1999, p. 45.
[Back] 37. CDAC, CDAC Report, FY 1999, p. 28, table 2.
[Back] 38. State of Maryland, General Assembly, Department of Legislative Services, “Fiscal Briefing, January 1998,” unpublished document circulated to members of the General Assembly, p. 23.
[Back] 39. State of Maryland, General Assembly, Department of Legislative Services, “Expenditure/Revenue Update,” No. 3, August 1997, unpublished document circulated to members of the General Assembly, p. 1.
[Back] 40. From data provided by DLS.
[Back] 41. The members of the CDAC are the state treasurer (chairman of the committee), the comptroller, the secretary of budget and management, the secretary of transportation and one member of the general public appointed by the governor. See State of Maryland, General Assembly, Department of Fiscal Services (DFS), The Budgetary Process, Legislative Handbook Series, Vol. IV (Annapolis, Md.: DFS, November 1994), p. 85.
[Back] 42. CDAC, CDAC Report, FY 1999, pp. 22-23.
[Back] 43. DFS, The Budgetary Process, p. 85.
[Back] 44. State of Maryland, General Assembly, Department of Fiscal Services (DFS), Effect of the 1992 Legislative Program on the Financial Condition of the State (Annapolis, Md.: DFS, June 1992), p. 1.
[Back] 45. DFS, The Budgetary Process, p. 88.
[Back] 46. Constitution of Maryland, article III, § 34; also see Editorial Board, “A Matter of Law: Is Rehrmann’s Property-Tax Ploy Illegal?” Calvert News, Vol. II, No. 4, Fall 1997, p. 1.
[Back] 47. State of Maryland, General Assembly, Department of Legislative Services, “Fiscal Year 1999 Budget Analysis, Operating Budget Data: Public Debt XA.00,” unpublished document distributed to legislators, dated January 1998, p. 2.
[Back] 48. DFS, Analysis, FY 1998, Vol. IV, p. 715.
[Back] 49. Editorial Board, “A Matter of Law: Is Rehrmann’s Property-Tax Ploy Illegal,” Calvert News, Vol. II, No. 4, Fall 1997, p. 1.
[Back] 50. Annotated Code of Maryland, State Finance and Procurement Article, § 8-117, para. 4.
[Back] 51. DFS, The Budgetary Process, p. 61.
[Back] 52. State of Maryland, General Assembly, Department of Fiscal Services (DFS), Maryland’s Tax Structure (Annapolis, Md.: DFS, October 1996), pp. 63-64.
[Back] 53. DFS, Analysis, FY 1998, Vol. IV, p. 721.
[Back] 54. CDAC, CDAC Report, FY 1999, p. 9.
[Back] 55. DFS, Analysis, FY 1998, Vol. IV, p. 721.
[Back] 56. CDAC, CDAC Report, FY 1999, p. 28, table 2.
[Back] 57. CDAC, CDAC Report, FY 1999, p. 43.
[Back] 58. Poole, “When Our Fiscal Hands Are Tied.”
[Back] 59. Derived from data in Gregory C. Spengler, Senior Analyst, Department of Legislative Services, General Assembly, State of Maryland, letter to Delegate D. Bruce Poole, dated October 7, 1997, pp. [1]-[10].
[Back] 60. Poole, “When Our Fiscal Hands Are Tied,” p. 10.
[Back] 61. All figures taken from ACIR, Significant Features of Fiscal Federalism, Vol. 2, pp. 124-125, table 63.
[Back] 62. State of Maryland, General Assembly, Department of Legislative Services, “Local Government Fiscal Overview,” unpublished document distributed to legislators, dated February 3, 1998 (revision date), p. 3.
[Back] 63. DLS, “Local Government Fiscal Overview,” p. 7, exhibit 3.
[Back] 64. From data provided by DFS and DLS, Analysis, FY 1999, p. 25.
[Back] 65. From data provided by DFS and DLS, Analysis, FY 1999, p. 25.
[Back] 66. State of Maryland, General Assembly, Department of Fiscal Services (DFS), The Sine Die Report: A Summary of Major Legislative Action (Annapolis, Md.: DFS) for years 1995, 1996 and 1997; State of Maryland, General Assembly, Department of Legislative Services (DLS), The 90 Day Report: A Review of Legislation in the 1998 Session, Vols. I and II (Annapolis, Md.: DLS, April 17, 1998), passim.
[Back] 67. Barry Rascovar, “Why Economic News Is Bad News,” (Baltimore) Sun, November 29, 1992.
[Back] 68. Jay Hancock, “Q&A: James Brady,” (Baltimore) Sun, May 17, 1998, p. 1F.
[Back] 69. State of Maryland, General Assembly, Department of Fiscal Services (DFS), Issue Papers, 1995 (Annapolis, Md.: DFS, November 1994), p. 243.
[Back] 70. State of Maryland, State Archives, Maryland Manual: A Guide to Maryland State Government, 1996-1997 (Annapolis, Md.: State Archives, 1996), passim. This reference book lists 15 cabinet departments and 80 independent agencies. However, during the 1998 legislative session, an independent agency called the Office on Aging was “promoted” to cabinet-level status and renamed the Department of Aging.
[Back] 71. Tom Bowman, “Assembly Passes on Tips to Streamline Government,” (Baltimore) Sun, April 12, 1993.
[Back] 72. Bowman, “Assembly Passes on Tips to Streamline Government.”
[Back] 73. R. Clayton Mitchell, Jr., Consolidation of Selected State Functions and Services: A Proposed Realignment of Maryland’s Government, Meeting the Fiscal Realities of the 1990s (Annapolis, Md.: General Assembly, Office of the Speaker, January 22, 1993), pp. 30, 50, 70.
[Back] 74. Editorial, “Government Efficiency by 2000?” (Baltimore) Sun, April 24, 1994.
[Back] 75. State of Maryland, General Assembly, Efficiency 2000 Commission, “Policy Initiatives for Consideration,” unpublished document, February 1995, attachment 1, p. [1].
[Back] 76. Efficiency 2000 Commission, “Policy Initiatives for Consideration,” attachment 4, pp. [1]-7.
[Back] 77. State of Maryland, General Assembly, Department of Fiscal Services (DFS), Analysis of the Maryland Executive Budget for the Fiscal Year Ending June 30, 1996, Vol. I, p. 558. (Hereinafter, DFS, Analysis, FY 1996.)
[Back] 78 F. Vernon Boozer, State Senate, General Assembly, State of Maryland, letter to Governor Parris N. Glendening, dated July 15, 1997.
[Back] 79. State of Maryland, General Assembly, Senate Bill 809 (1995).
[Back] 80. State of Maryland, General Assembly, Department of Legislative Reference (DLR), 1995 Session Review (Annapolis, Md.: DLR, April 1995), pp. 67-68; see also, General Assembly, Senate Bill 810/House Bill 1185 (1995).
[Back] 81. State of Maryland, General Assembly, House Bill 348 (1996).
[Back] 82 State of Maryland, General Assembly, Department of Legislative Reference (DLR), 1996 Session Review (Annapolis, Md.: DLR, April 1996), p. 69; see also House Bill 1442 (1996).
[Back] 83. DLS, The 90 Day Report, p. C-1.
[Back] 84. CDAC, CDAC Report, FY 1999, pp. 44, 46.
[Back] 85. CDAC, CDAC Report, FY 1999, p. 26.
[Back] 86. CDAC, CDAC Report, FY 1999, pp. 44-45.
[Back] 87. For a discussion about the use of various types of state bond, see CDAC, CDAC Report, FY 1999, pp. 4-21. The quoted phrases are from p. 4.
[Back] 88. CDAC, CDAC Report, FY 1999, p. 45.
[Back] 89. CDAC, CDAC Report, FY 1999, p. 8.
[Back] 90. Derived from data in State of Maryland, Office of the Comptroller, Board of Revenue Estimates (BRE), Estimated Maryland Revenues: Fiscal Years Ending June 30, 1998 and June 30, 1999 (Annapolis, Md.: BRE, December 15, 1997), p. 50 (hereinafter, BRE, Estimated Maryland Revenues, FY 1998 and FY 1999); Louis L. Goldstein, Richard N. Dixon and Frederick W. Puddester, Board of Revenue Estimates, Office of the Comptroller, State of Maryland, letter to Parris N. Glendening, Governor, State of Maryland, dated March 10, 1998.
[Back] 91. Dale Snyder, “Building Bureaucracy and Invading Patient Privacy: Maryland’s Health Care Regulations,” Heritage Foundation Backgrounder, No. 1168, April 17, 1998, p. 9.
[Back] 92. Office of Ellen R. Sauerbrey, House of Delegates, General Assembly, “House Republicans Turn Spotlight on State Payroll Questions,” press released dated February 3, 1993.
[Back] 93. Sauerbrey, “House Republicans Turn Spotlight on State Payroll Questions.”
[Back] 94. State of Maryland, General Assembly, Chairmen of the Senate Budget and Taxation Committee and House Appropriations Committee, Report on the State Operating Budget (SB 125) and Related Recommendations (Annapolis, Md.: Department of Legislative Services, April 1998), p. 60. (Hereinafter, Joint Chairmen’s Report – Operating, 1998.)
[Back] 95. DFS, Analysis, FY 1998, Vols. I-IV, passim.
[Back] 96. Karl S. Aro, Executive Director, Department of Legislative Services, General Assembly, State of Maryland, letter to state Delegate Anita J. Stup, dated February 23, 1998, p. 2.
[Back] 97. The governor’s budget request for fiscal 1999 claims state ownership of 8,000 light vehicles. The Department of Legislative Services quotes the Department of Budget and Management as claiming 80 percent of the whole fleet of 10,700 to be light vehicles, which would be 8,560. See Aro, letter to Stup, February 23, 1998, p. 2; see also State of Maryland, Department of Budget and Management (DBM), Maryland FY 1999 Budget: Operating Budget, Part One (Annapolis, Md.: DBM, [January 1998]), p. 319.
[Back] 98. Aro, letter to Stup, February 23, 1998, p. 1.
[Back] 99. Aro, letter to Stup, February 23, 1998, p. 2.
[Back] 100. This figure is derived as follows: The state estimates that the total mileage driven by its 8,000-vehicle light fleet will be 120 million miles in FY 1999, or 15,000 per vehicle. In total, we propose reducing state-vehicle usage for about 1,600 officials, who presumably drive 24 million miles a year between them (1,600 officials x 15,000 miles). At 28¢ a mile reimbursement, 24 million miles would equal about $6.72 million.
[Back] 101. Hancock, “Q&A: James Brady.”
[Back] 102. State of Maryland, General Assembly, Senate Bill 125, Ch. 109 (1998), Budget Bill, Fiscal 1999, pp. 196-215. (Hereinafter, Budget Bill, FY 1999.)
[Back] 103. The functions currently carried by the Department of Legislative Services were previously the purview of two distinct agencies, the Department of Fiscal Services and the Department of Legislative Reference. In 1997, these two were merged to form the DLS.
[Back] 104. State of Maryland, General Assembly, Joint Expenditure and Revenue Study Group, Technical Supplement, Vol. II (Annapolis, Md.: Department of Fiscal Services, January 1992), pp. 459-460.
[Back] 105. State of Maryland, General Assembly, Department of Fiscal Services (DFS), Analysis of Budget Recommendations of the Maryland Taxpayers Association (Annapolis, Md.: DFS, February 1997), pp. 12-13.
[Back] 106. State of Maryland, General Assembly, Department of Fiscal Services (DFS), Analysis of Prevailing Wage Legislation (Annapolis, Md.: DFS, November 1983), p. 12.
[Back] 107. Shelley Finlayson, “Prevailing Wage Law – Repeal,” Department of Fiscal Services Fiscal Note, February 14, 1997, p. 2.
[Back] 108. DLS, Analysis, FY 1999, Vol. V, p. 3.
[Back] 109. DFS, Analysis, FY 1998, Vol. V, p. 3.
[Back] 110. Finlayson, “Prevailing Wage Law – Repeal,” p. 2.
[Back] 111. Finlayson, “Prevailing Wage Law – Repeal,” p. 2.
[Back] 112. William S. Ratchford II, Director, Department of Fiscal Services, General Assembly, State of Maryland, memorandum to legislative fiscal committee chairs, dated November 7, 1991. (The fiscal committees are the Senate Budget and Taxation Committee, the Senate Finance Committee, the House Appropriations Committee and the House Ways and Means Committee.)
[Back] 113. Finlayson, “Prevailing Wage Law – Repeal,” p. 1.
[Back] 114. Finlayson, “Prevailing Wage Law – Repeal,” p. 2.
[Back] 115. DLS, Analysis, FY 1999, Vol. II, p. 120.
[Back] 116. State of Maryland, General Assembly, Department of Legislative Services (DLS), Issue Papers: 1998 Legislative Session (Annapolis, Md.: DLS, December 1997), p. 44.
[Back] 117. Spending Affordability Committee, Report of the 1997 Interim, p. 26.
[Back] 118. State of Maryland, General Assembly, Joint Committee on Pensions, Report of the 1997 Interim (Annapolis, Md.: Department of Legislative Services, December 1997), p. 77.
[Back] 119. Spending Affordability Committee, Report of the 1997 Interim, p. 32.
[Back] 120. Joint Committee on Pensions, Report of the 1997 Interim, p. 79, exhibit 6.
[Back] 121. . All figures taken from Budget Bill, FY 1999, pp. 138-140.
[Back] 122. DBM, Maryland FY 1999 Budget: Operating Budget, Part One, p. 263.
[Back] 123. Budget Bill, FY 1999, p. 29.
[Back] 124. BRE, Estimated Maryland Revenues, FY 1998 and FY 1999), executive summary.
[Back] 125. DFS, Analysis, FY 1998, Vol. I, p. 429.
[Back] 126. Budget Bill, FY 1999, p. 21.
[Back] 127. Warren G. Descheneaux, Director, Office of Policy Analysis, Department of Legislative Services, General Assembly, State of Maryland, memorandum to Howard P. Rawlings, Chairman, Committee on Appropriations, House of Delegates, General Assembly, dated November 3, 1993, p. 1.
[Back] 128. Maryland Economic Development Corporation (MEDCO), Maryland Economic Development Corporation Annual Report, 1991-1992 (Baltimore, Md.: MEDCO, [no date]), p. [7].
[Back] 129. DFS, Analysis, FY 1998, Vol. IV, p. 589.
[Back] 130. DFS, Analysis, FY 1998, Vol. I, p. 219.
[Back] 131. DLS, Analysis, FY 1999, Vol. I, p. 242.
[Back] 132. DLS, Issue Papers: 1998, pp. 18-19; DLS, Analysis, FY 1999, Vol. I, p. 237.
[Back] 133. Stephen C. Fehr, “Md. Stadium Authority Is Losing Fans,” Washington Post, April 2, 1998, p. D6.
[Back] 134. Craig Timberg, “Stadium Support May Haunt Governor,” (Baltimore) Sun, July 24, 1998, p. 1A.
[Back] 135. DLS, Analysis, FY 1999, Vol. III, p. 582.
[Back] 136. State of Maryland, General Assembly, Chairmen of the Senate Budget and Taxation Committee and House Appropriations Committee, Report on the State Operating Budget (HB 175) and Related Recommendations (Annapolis, Md.: Department of Fiscal Services, April 1997), p. 116. (Hereinafter, Joint Chairmen’s Report – Operating, 1997.)
[Back] 137. Margaret Schnoor, Office of Nancy R. Stocksdale, House of Delegates, General Assembly, State of Maryland (citing a conversation with Matt Power, Office of Policy Analysis, Department of Legislative Services, General Assembly, State of Maryland), conversation with the author, July 23, 1998.
[Back] 138. Joint Chairmen’s Report – Operating, 1997, p. 116.
[Back] 139. DLS, Analysis, FY 1999, Vol. II, p. 435.
[Back] 140. DLS, Analysis, FY 1999, Vol. II, p. 435.
[Back] 141. DLS, Analysis, FY 1999, Vol. III, p. 582.
[Back] 142. State of Maryland, General Assembly, Department of Fiscal Services, Office of Legislative Audits, Performance Audit Report: Maryland State Department of Education (Annapolis, Md.: DFS, August 1996). p. 7.
[Back] 143. Budget Bill, FY 1999, p. 126.
[Back] 144. Douglas P. Munro, John E. Berthoud and Carol L. Hirschburg, “Choice, Polls and the American Way,” Calvert News, Vol. II, No. 2, Spring 1997, pp. 8-9, 17-19, at 17-18.
[Back] 145. Leslie Gross, “Gary, Parham Tensions Rise,” (Annapolis) Capital, May 6, 1998. p. A1.
[Back] 146. Tanya Jones, “Arundel County Executive Asks for More Money for Schools,” (Baltimore) Sun, July 21, 1998, p. 2B.
[Back] 147. DFS, Performance Audit Report, preface cover letter.
[Back] 148. DFS, Performance Audit Report, p. 5.
[Back] 149. DFS, Performance Audit Report, p. 9.
[Back] 150. DFS, Performance Audit Report, p. 15.
[Back] 151. DFS, Performance Audit Report, p. 25.
[Back] 152. DFS, Performance Audit Report, pp. 15, 19, 25.
[Back] 153. State of Maryland, Task Force on Funding Equity, Accountability and Partnerships, Technical Supplement, Vol. II (Annapolis, Md.: Department of Legislative Services, December 1997), pp. 261-274.
[Back] 154. DLS, Analysis, FY 1999, Vol. IV, p. 311, ex. 1.
[Back] 155. DLS, Analysis, FY 1999, Vol. IV, p. 310.
[Back] 156. DLS, Analysis, FY 1999, Vol. IV, p. 314.
[Back] 157. DLS, Analysis, FY 1999, Vol. IV, p. 312.
[Back] 158. DLS, Analysis, FY 1999, Vol. IV, p. 311.
[Back] 159. DLS, Analysis, FY 1999, Vol. IV, p. 311.
[Back] 160. Budget Bill, FY 1999, p. 26.
[Back] 161. DLS, Analysis, FY 1999, Vol. I, p. 583.
[Back] 162. DLS, Analysis, FY 1999, Vol. I, p. 593.
[Back] 163. DBM, Maryland FY 1999 Budget: Operating Budget, Part One, p. 209.
[Back] 164. DBM, Maryland FY 1999 Budget: Operating Budget, Part One, p. 209.
[Back] 165. Budget Bill, FY 1999, p. 26.
[Back] 166. DLS, Analysis, FY 1999, Vol. I, p. 593.
[Back] 167. Budget Bill, FY 1999, p. 58.
[Back] 168. Budget Bill, FY 1999, p. 59.
[Back] 169. Parris N. Glendening, “Governor Introduces Rural Legacy Program,” State of Maryland, Department of Agriculture MDA News, Vol. 8, No. 1, Winter 1997, p. 1.
[Back] 170. State of Maryland, Department of Budget and Management (DBM), Maryland FY 1999 Budget: Capital Budget (Annapolis, Md.: DBM, [January 1998]), p. 217.
[Back] 171. DBM, Maryland FY 1999 Budget: Capital Budget, p. 217.
[Back] 172. John R. Griffin, Secretary, Department of Natural Resources, State of Maryland, letter to Rural Legacy applicants, dated September 11, 1997, part of handout package accompanying letter.
[Back] 173. Annotated Code of Maryland, Natural Resources Article, § 5-9A-09.
[Back] 174. DFS, Analysis, FY 1998, Vol. I, p. 244.
[Back] 175. DFS, Analysis, FY 1998, Vol. I, p. 245.
[Back] 176. DLS, Analysis, FY 1999, Vol. I, p. 263.
[Back] 177. Joint Chairmen’s Report – Operating, 1997, p. 23.
[Back] 178. Joint Chairmen’s Report – Operating, 1997, p. 23.
[Back] 179. Joint Chairmen’s Report – Operating, 1998, p. 29.
[Back] 180. Joint Chairmen’s Report – Operating, 1997, p. 27.
[Back] 181. Joint Chairmen’s Report – Operating, 1997, p. 29.
[Back] 182. DBM, Maryland FY 1999 Budget: Operating Budget, Part One, p. 129.
[Back] 183. DBM, Maryland FY 1999 Budget: Operating Budget, Part One, p. 135.
[Back] 184. DBM, Maryland FY 1999 Budget: Operating Budget, Part One, p. 129.
[Back] 185. DBM, Maryland FY 1999 Budget: Operating Budget, Part One, p. 131.
[Back] 186. DBM, Maryland FY 1999 Budget: Operating Budget, Part One, p. 128.
[Back] 187. DLS, Analysis, FY 1999, Vol. I, p. 499.
[Back] 188. DBM, Maryland FY 1999 Budget: Operating Budget, Part One, p. 186.
[Back] 189. DBM, Maryland FY 1999 Budget: Operating Budget, Part One, p. 128.
[Back] 190. DBM, Maryland FY 1999 Budget: Operating Budget, Part One, p. 127.
[Back] 191. State of Maryland, State Archives, “Maryland Manual On-Line,” Interstate Agencies, National Conference of Commissioners on Uniform State Laws, Internet site (http://www.mdarchives. state.md.us/msa/mdmanual/38inters/html/22unif.html), downloaded May 23, 1998.
[Back] 192. State of Maryland, State Archives, “Maryland Manual On-Line,” Interstate Agencies, Internet site (http://www.mdarchives.state.md.us/msa/mdmanual/01glance/html/inters.html), downloaded May 23, 1998.
[Back] 193. National Conference of Commissioners on Uniform State Laws (NCCUSL), “National Conference of Commissioners on Uniform State Laws,” Internet site (http://www.kentlaw.edu/ ulc/brochure.html), downloaded May 23, 1998.
[Back] 194. Council of State Governments (CSG), “CSG – Legislation Publications,” Internet site (http://www.csg.org/new_pubs/legislation), downloaded May 23, 1998.
[Back] 195. Budget Bill, FY 1999, p. 15
[Back] 196. DFS, Analysis, FY 1998, Vol. I, p. 356.
[Back] 197. Derived from data in Leadership Directories, Inc. (LDI), State Yellow Book, Winter 1996 (Washington, D.C.: LDI, 1996), passim.
[Back] 198. DBM, Maryland FY 1999 Budget: Operating Budget, Part One, pp. 227, 230.
[Back] 199. DBM, Maryland FY 1999 Budget: Operating Budget, Part One, p. 325.
[Back] 200. DLS, Analysis, FY 1999, Vol. II, p. 84, ex. 6.
[Back] 201. DBM, Maryland FY 1999 Budget: Operating Budget, Part One, pp. 713-726.
[Back] 202. DBM, Maryland FY 1999 Budget: Operating Budget, Part Two, p. 19.
[Back] 203. DBM, Maryland FY 1999 Budget: Operating Budget, Part Two, p. 19.
[Back] 204. Budget Bill, FY 1999, p. 97.
[Back] 205. DLS, Analysis, FY 1999, Vol. I, p. 215.
[Back] 206. DLS, Analysis, FY 1999, Vol. I, p. 215.
[Back] 207 DBM, Maryland FY 1999 Budget: Operating Budget, Part One, p. 117.
[Back] 208. DLS, The 90 Day Report, p. C-1.
[Back] 209. Budget Bill, FY 1999, p. 16.
[Back] 210. DLS, Analysis, FY 1999, Vol. I, p. 305.
[Back] 211. This figure is derived by dividing $3,880,109 in funds budgeted for salaries and benefits by 51.5 FTE staff and contractual positions. See DBM, Maryland FY 1999 Budget: Operating Budget, Part One, p. 143.
[Back] 212. DLS, Analysis, FY 1999, Vol. I, p. 303.
[Back] 213. Douglas P. Munro, “Deadly Maryland,” Calvert News, Vol. III, No. 1, Winter 1998, p. 6.
[Back] 214. Joint Chairmen’s Report – Operating, 1997, p. 251.
[Back] 215. . Alan Fisher, Days Trips in Delmarva: A Guide to Southern Delaware and the Eastern Shore of Maryland and Virginia (Baltimore, Md.: Rambler Books, 1992), p. 160.
[Back] 216. Mitchell, Consolidation of Selected State Functions and Services, pp. 68-70.
[Back] 217. DFS, Analysis, FY 1999, Vol. I, p. 25.
[Back] 218 State of Maryland, General Assembly, Joint Expenditure and Revenue Study Group, Final Report (Annapolis, Md.: Department of Fiscal Services, December 1991), p. 254.
[Back] 219 State of Maryland, General Assembly, Department of Fiscal Services (DFS), Maryland Local Government: Revenues and State Aid, Legislative Handbook Series, Vol. VII (Annapolis, Md.: DFS, November 1994), pp. 15, 25.
[Back] 220. Budget Bill, FY 1999, p. 32.
[Back] 221. DLS, Analysis, FY 1999, Vol. I, p. 25, note 3.
[Back] 222. Derived from data in State of Maryland, General Assembly, Department of Fiscal Services (DFS), Maryland’s Revenue Structure, Legislative Handbook Series, Vol. III (Annapolis, Md.: DFS, November 1994), p. 88, exhibit 6.1; and DFS, Maryland Local Government: Revenue and State Aid, Legislative Handbook Series, Vol. VII (Annapolis, Md.: DFS, November 1994), p. 27, exhibit 2.11. According to these sources, combined local-government property-tax revenue was $3.246 billion in FY 1993. State property-tax revenue was $0.210 billion, for a total of $3.456 billion.
[Back] 223. See DBM, Maryland FY 1999 Budget: Operating Budget, Part Two, p. 109 under the line item, “grants, subsidies and contributions.”
[Back] 224. DBM, Maryland FY 1999 Budget: Operating Budget, Part Two, p. 109.
[Back] 225. Jeff Hooke, “Crying ‘Wolf!’ Among the Horses,” (Baltimore) Sun, September 24, 1997, p. 17A.
[Back] 226. Timberg, “Stadium Support May Haunt Governor.”
[Back] 227. Joint Chairmen’s Report – Operating, 1997, p. 33.
[Back] 228. State of Maryland, General Assembly, Department of Legislative Services (DLS), The Feasibility of Consolidating Administrative Appeals Agencies: A Report to the Maryland General Assembly (Annapolis, Md.: DLS, September 1997), p. 11.
[Back] 229. State of Maryland, General Assembly, Department of Fiscal Services (DFS), Analysis of the Maryland Executive Budget for the Fiscal Year Ending June 30, 1997, Vol. I (Annapolis, Md.: DFS, March 1996), p. 133.
[Back] 230. William F. Zorzi, Jr. and Greg Garland, “Scandals Place Md. Prosecutor in Spotlight,” (Baltimore) Sun, July 9, 1998, p. 1A.
[Back] 231. Zorzi and Garland, “Scandals Place Md. Prosecutor in Spotlight.”
[Back] 232. [State of Maryland, General Assembly, Department of Fiscal Services], “Arguments in Favor of Continuing or Abolishing/Restructuring the Office of the State Prosecutor,” unpublished document, undated, p. [5].
[Back] 233. Budget Bill, FY 1999, p. 9.
[Back] 234. DBM, Maryland FY 1999 Budget: Operating Budget, Part One, p. 72.
[Back] 235. Zorzi and Garland, “Scandals Place Md. Prosecutor in Spotlight.”
[Back] 236. DBM, Maryland FY 1999 Budget: Operating Budget, Part One, p. 353.
[Back] 237. DLS, Analysis, FY 1999, Vol. II, p. 130.
[Back] 238. DLS, Analysis, FY 1999, Vol. II, p. 110.
[Back] 239. Budget Bill, FY 1999, pp. 38-39.
[Back] 240. DBM, Maryland FY 1999 Budget: Operating Budget, Part One, p. 196.
[Back] 241. DBM, Maryland FY 1999 Budget: Operating Budget, Part One, p. 363.
[Back] 242. Budget Bill, FY 1999, p. 24.
[Back] 243. DLS, Analysis, FY 1999, Vol. I, p. 537.
[Back] 244. DLS, Analysis, FY 1999, Vol. I, p. 537.
[Back] 245. State of Maryland, General Assembly, Department of Fiscal Services, The Sine Die Report: A Summary of Legislative Action, 1993 Session (Annapolis, Md.: April 13, 1993), p. 5.
[Back] 246. DLS, The 90 Day Report, 1998, p. A-19.
[Back] 247. DLS, Analysis, FY 1999, Vol. IV, p. 669; DLS, The 90 Day Report, 1998, p. A-19.
[Back] 248. Poulson, “A Study of State and Local Government Fiscal Restraint Mechanisms, Part I,” p. 25.
[Back] 249. DLS, Analysis, FY 1999, Vol. IV, p. 671.
[Back] 250. Budget Bill, FY 1999, p. 167.
[Back] 251. DLS, Analysis, FY 1999, Vol. IV, p. 671.
[Back] 252. For an extensive discussion on this subject, see Dale Rubin, “Public Funds into Private Pockets: How Corporate Welfare Offends the Constitution,” Calvert News, Vol. I, No. 2, p. 6.
[Back] 253. DBM, Maryland FY 1999 Budget: Operating Budget, Part Two, p. 818.
[Back] 254. DLS, Issue Papers: 1998, p. 6.
[Back] 255. DLS, Issue Papers: 1998, p. 6.
[Back] 256. DLS, Analysis, FY 1999, Vol. IV, p. 672.
[Back] 257. DLS, Analysis, FY 1999, Vol. IV, p. 396.
[Back] 258. DLS, Analysis, FY 1999, Vol. IV, p. 396.
[Back] 259. DLS, Analysis, FY 1999, Vol. IV, p. 395.
[Back] 260. DFS, Analysis, FY 1998, Vol. IV, p. 483.
[Back] 261. DFS, Analysis, FY 1998, Vol. IV, p. 483.
[Back] 262. DFS, Analysis, FY 1998, Vol. IV, p. 489.
[Back] 263. Budget Bill, FY 1999, p. 131.
[Back] 264. Budget Bill, FY 1999, pp. 131-132, 255-256, 282.
Posted in: Efficiency in Government, Issue Brief